
Find 8%: A Week Inside a Savings Mandate
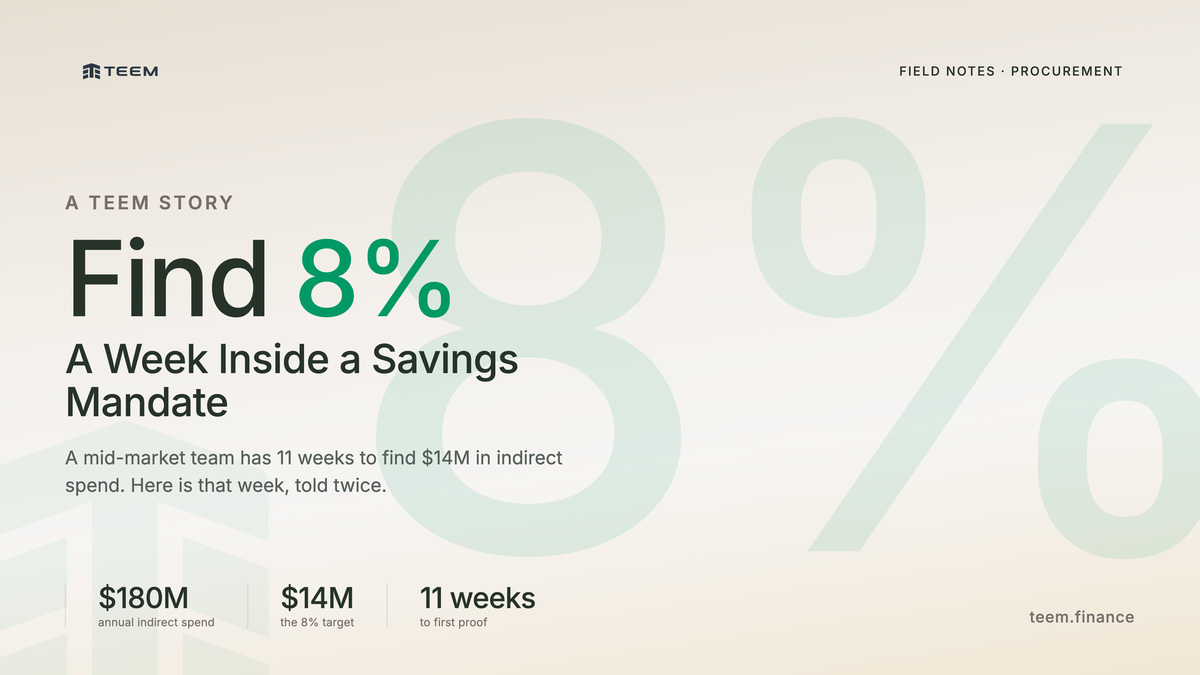
The company and the figures below are a composite, built from real mid-market indirect teams rather than any single customer. It's a common situation, and one we see in some shape or form almost every week.
On a Monday in early spring, the CFO forwards a single slide to the company's VP of procurement. The company runs about $540M in revenue and spends roughly $180M a year on indirect categories: facilities, IT, logistics, professional services, and the consumables that never make it onto a strategic sourcing plan. The slide is from the board deck. Margins are tightening, and procurement's contribution for the year has just become a committed line rather than an aspiration: a credible path to 8% indirect savings, with proof by the end of the first quarter.
Eight percent of $180M is about $14M. The VP has 11 weeks to show the board where the first real slice is.
What follows is that week, told twice. The first version is how many good teams still run it. The second is what changes when they spend, the categories, and the suppliers stop living in separate systems.
Monday: the number lands
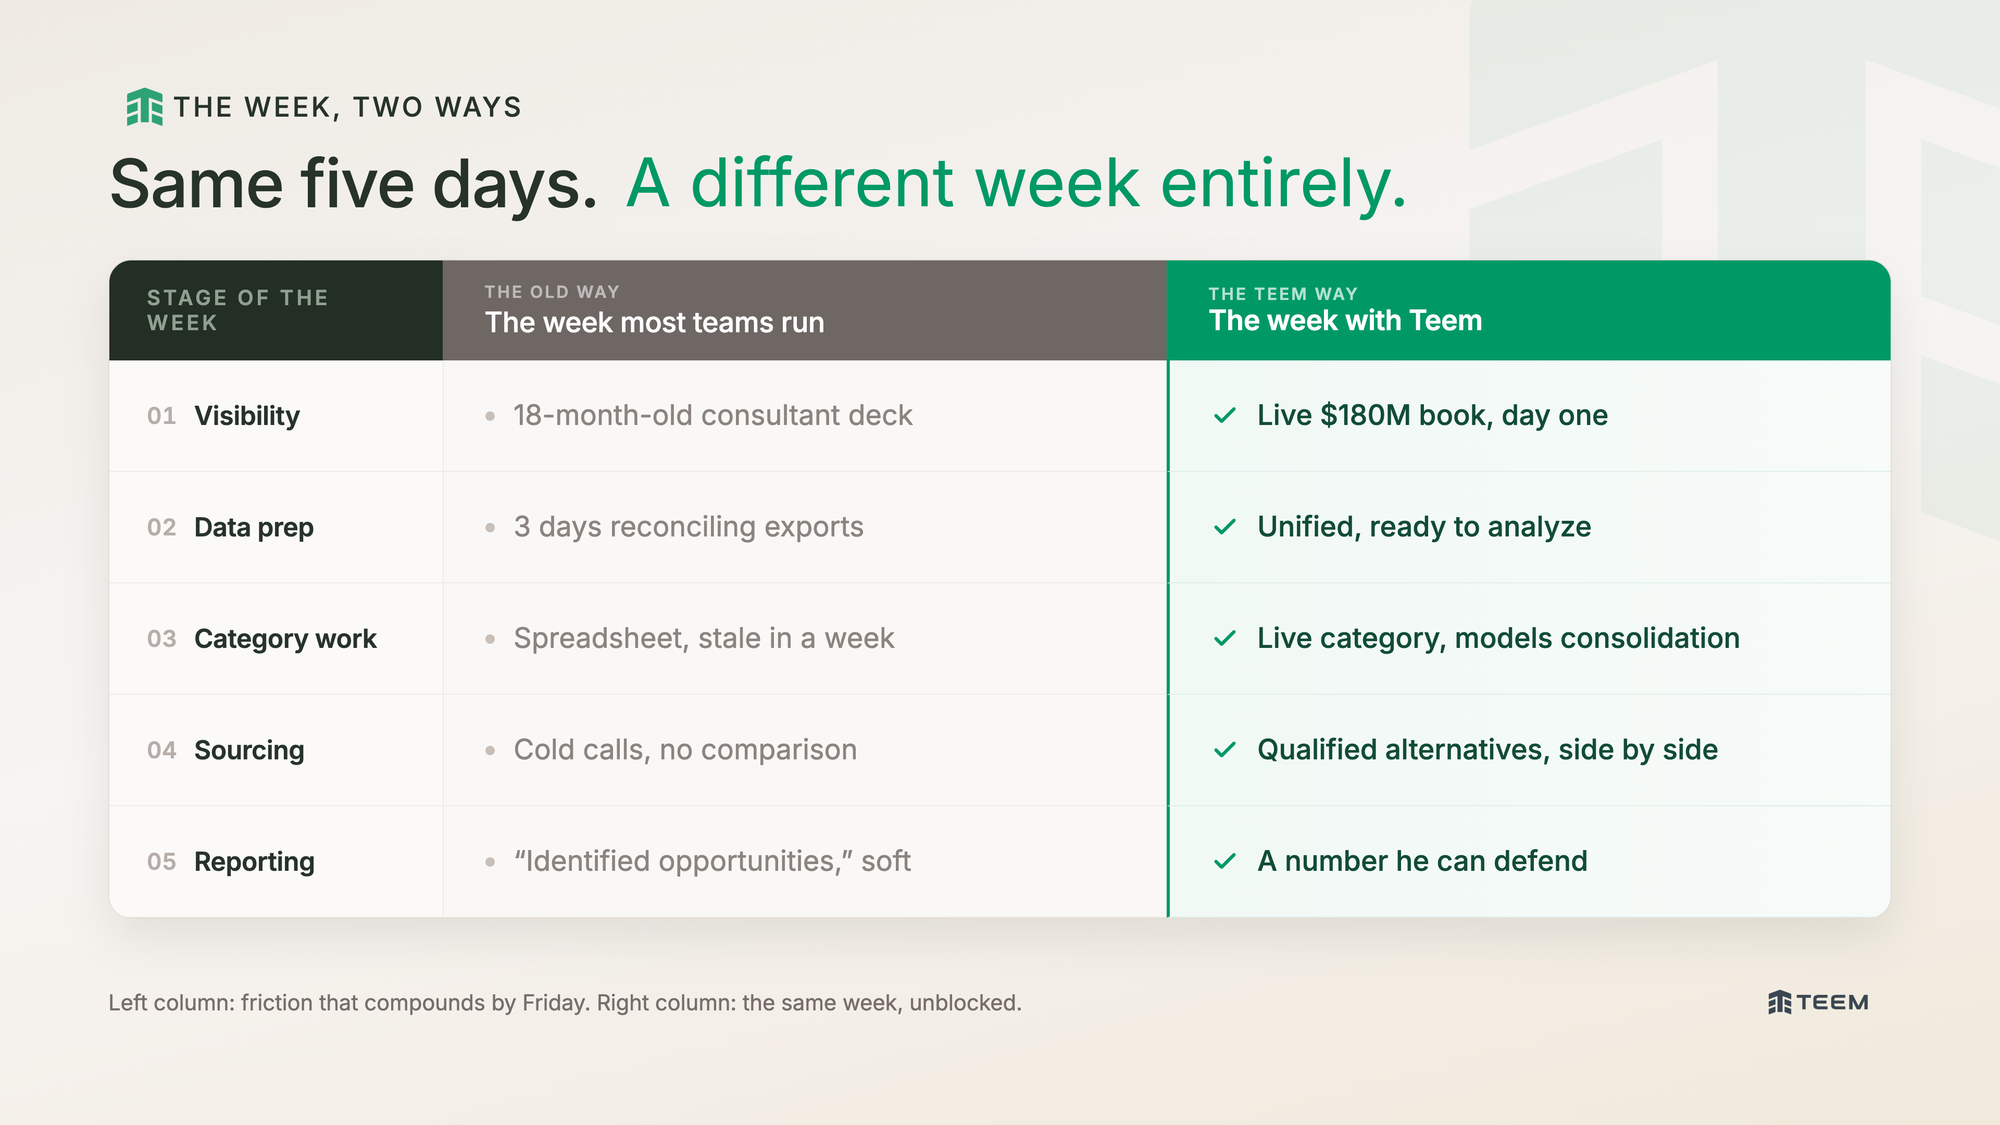
- The VP's instinct is to ask the category manager a reasonable question: Where can we realistically find 8%? It's the right question. It's also one nobody at the company can answer on a Monday, because the last real baseline of indirect spend is a consultant's deck from eighteen months ago, and half of it is already stale. He's being asked to commit to a number before he can see the shape of the thing the number came from. Right now, the book is $180M wide and mostly dark.
- With Teem, the VP opens Portfolio Analysis before he replies to anyone. The full indirect book is already there: spend by category, by supplier, with concentration at the top and the long tail underneath. Within a few minutes, he can see that the 8% isn't spread evenly. It's lumpy. A handful of categories account for most of the opportunities, and a few of them have no negotiated rate behind them at all. He still has a hard number to hit, but he no longer has to guess where it lives. When he replies to the category manager, he sends a starting point instead of a question.
Tuesday to Thursday: finding the leak
- Finding the opportunity means finding the leakage, so the category manager hands it to the analyst. He spends the better part of three days pulling exports: one from the ERP, three from separate supplier portals, and one from a facilities spreadsheet a site manager keeps by hand. Then he spends most of what's left reconciling them, because the same vendor shows up as "Staples Inc," "Staples Business Advantage," and "STAPLE-01" depending on which system you ask. By Thursday afternoon, the data is finally clean enough to trust, but no actual analysis has been done yet. The week is half gone, and the team has produced a tidy spreadsheet, not a decision.
- With Teem, the spend is already unified and de-duplicated before the analyst opens it, so he's reading one picture instead of stitching five together. Portfolio Analysis surfaces the things that were always there and always hard to see: spending running outside of contract, two departments paying different rates to the same supplier for the same service, whole categories with no agreement behind them. Three days of cleanup turn into an afternoon of finding money. By Thursday, the category manager has a ranked list of where the 8% actually hides.
The fat target: facilities
- The biggest single target is facilities and MRO, fragmented across more than forty suppliers, with nothing consolidating them. The category manager knows it's a mess. What she doesn't have is a structured way to work it, so she builds another spreadsheet: suppliers in one column, contract values, renewal dates, and annual spend, all maintained by hand. It's accurate the day she builds it and stale a week later. The category strategy lives in her head and in a file she updates alone, and it doesn't survive the first change in the real world.
- With Teem, Category Management gives her the category to hold onto. Every supplier, contract, spend figure, and expiry date sits in a single live view that updates as the underlying data changes. She can see that forty-plus facilities suppliers are doing the work of a handful. More usefully, she can model the consolidation directly: move this volume to three vendors instead of forty, and the rate improvement and the resulting number are right there. The strategy stops being a document she has to defend and becomes a position she can adjust.
The alternatives, and the rest of the company
- Consolidation only works if there are suppliers who can absorb the combined volume, so the analyst goes looking for them. In this version, looking means web searches, asking around, and sitting through a few cold sales calls, with no fast way to compare what comes back. This is also the point where the work leaves procurement. The facilities manager hears "consolidation" and worries it means worse service across his sites. Finance wants proof that the savings are real before anyone signs anything. Everyone is working from a different version of the facts, so the savings case doesn't stall on the math. It stalls on trust.
- With Teem, Supplier Discovery provides the analyst with qualified alternatives quickly, with the comparison already laid out rather than assembled by hand. That saves time. What changes the outcome is what happens next. The category manager pulls the facilities manager and the finance partner into the same view. The facilities manager sees coverage across all his sites, so consolidation no longer sounds like a downgrade. Finance sees the validated number behind the projection, so the savings stop sounding like a hope. This is the quieter argument running under the whole series: Teem is built for procurement, but the moment a procurement decision touches operations and budget, which is most of the time, the thing that unblocks it is everyone finally looking at the same picture.
Friday: reporting back
- Friday's check-in with the CFO. In the version most teams run, the VP brings a spreadsheet of "identified opportunities" along with many caveats. The numbers are soft. Some may materialize and some may not, and he can't say with much confidence which is which. He's reporting effort.
- With Teem, he brings a number he can defend. He can point to the path to 8%, show where the first several million comes from, split between consolidation and re-rated categories, and name what's already in motion and what proof looks like by quarter-end. The mandate that felt like a demand on Monday is a plan by Friday. Same team, same eleven weeks, same $180M. The only difference is that the work no longer falls apart at every handoff.
What actually changed
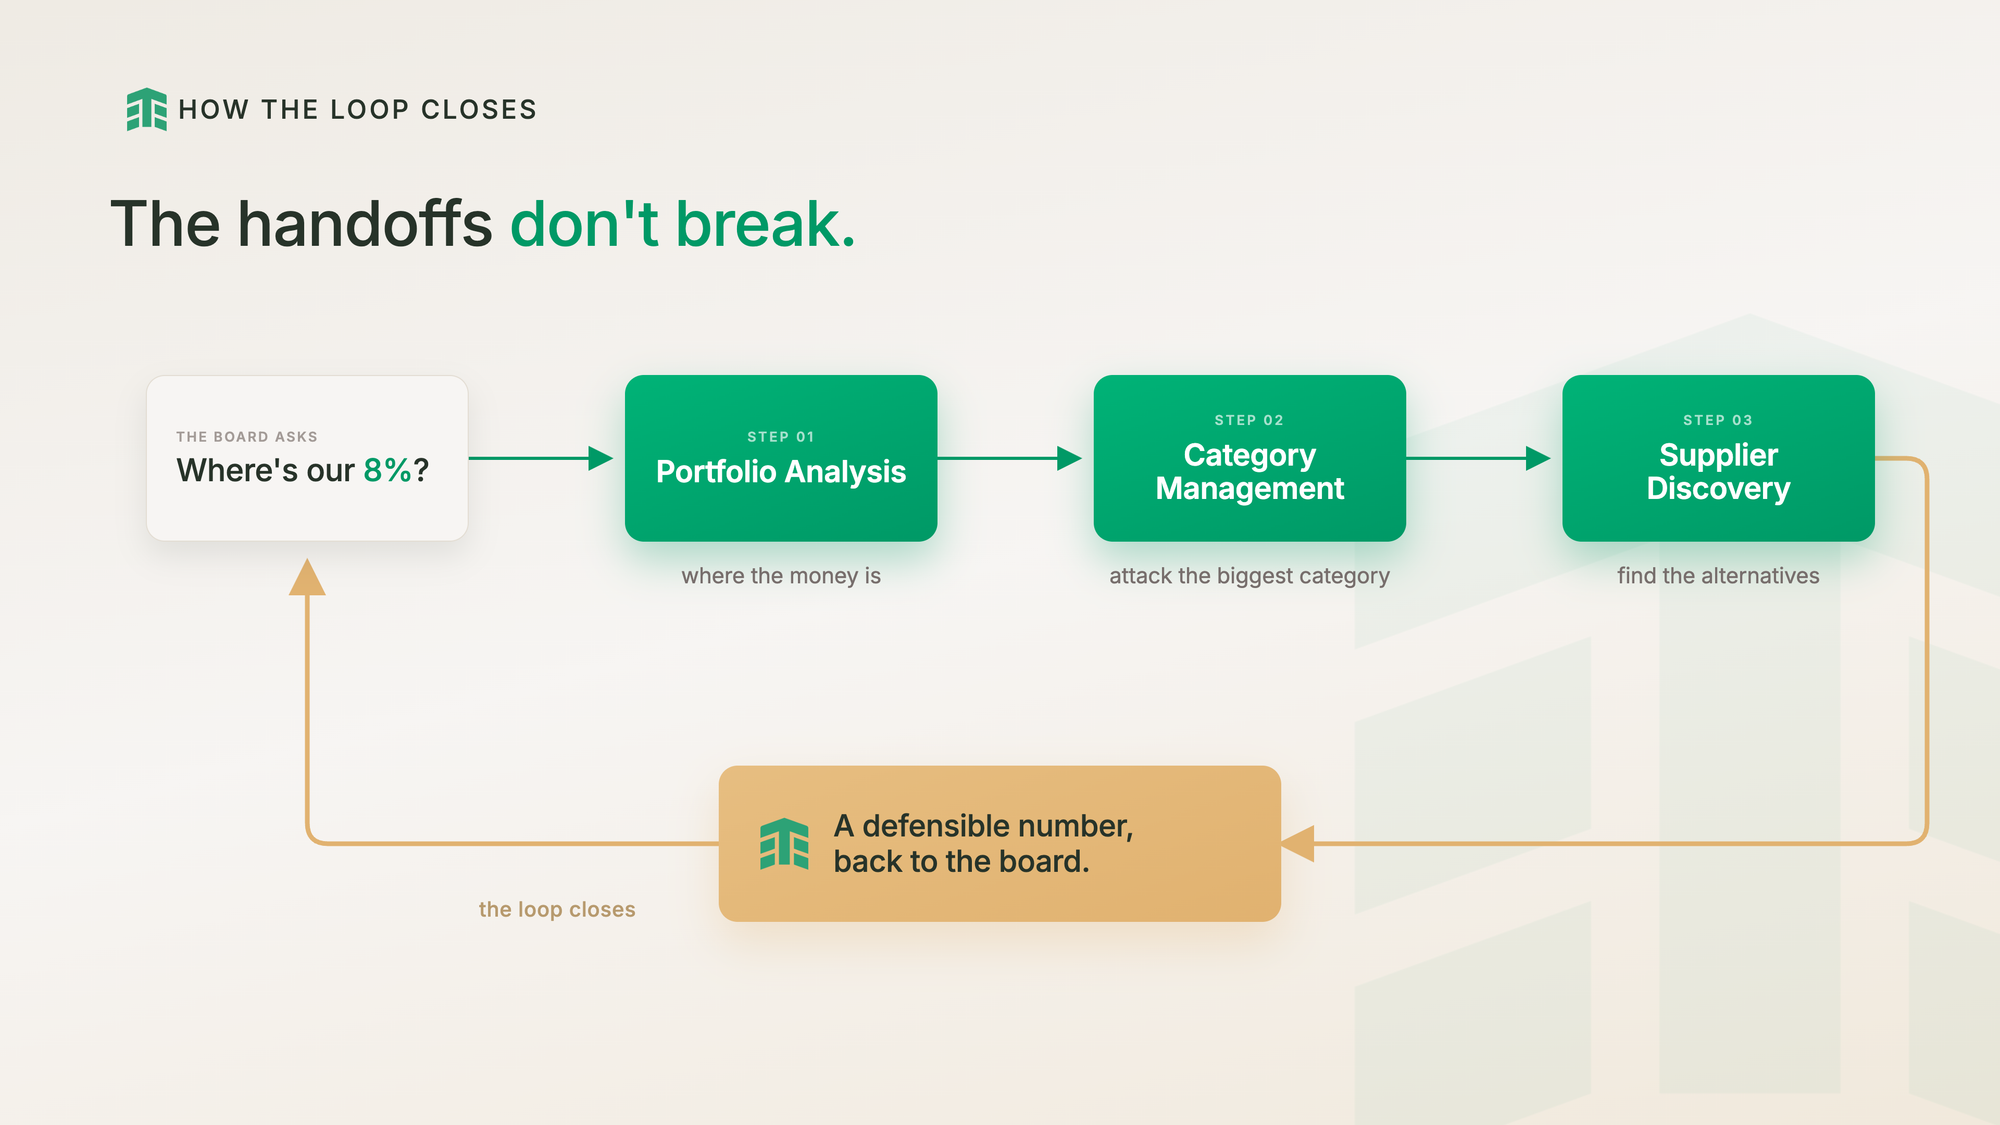
Step back from the week for a second, because the lesson isn't any single feature. It's that one question: where is our 8%? It traveled from the boardroom to an analyst's screen and back without breaking on the way. The spend fed the categories, the categories pointed to the suppliers, and the supplier work fed the number the VP reported. One connected system did the thing a stack of disconnected tools and hand-built spreadsheets keeps failing to do under a real deadline: hold together.
This is the first of three weeks we'll spend with this team. The next one starts less kindly. A supplier everyone quietly depended on begins to fail, and the clock is far less forgiving.
If your indirect spend still lives across exports and spreadsheets, that's the version of the week worth changing first. Learn more at www.teem.finance.