Introducing Category Management: From Spreadsheet Sprawl to Strategic Ownership
Category Management is now in early access. One place to set your strategy goal, track spend, assess supplier fit, read the market, and manage risk — all backed by evidence your team actually sourced.
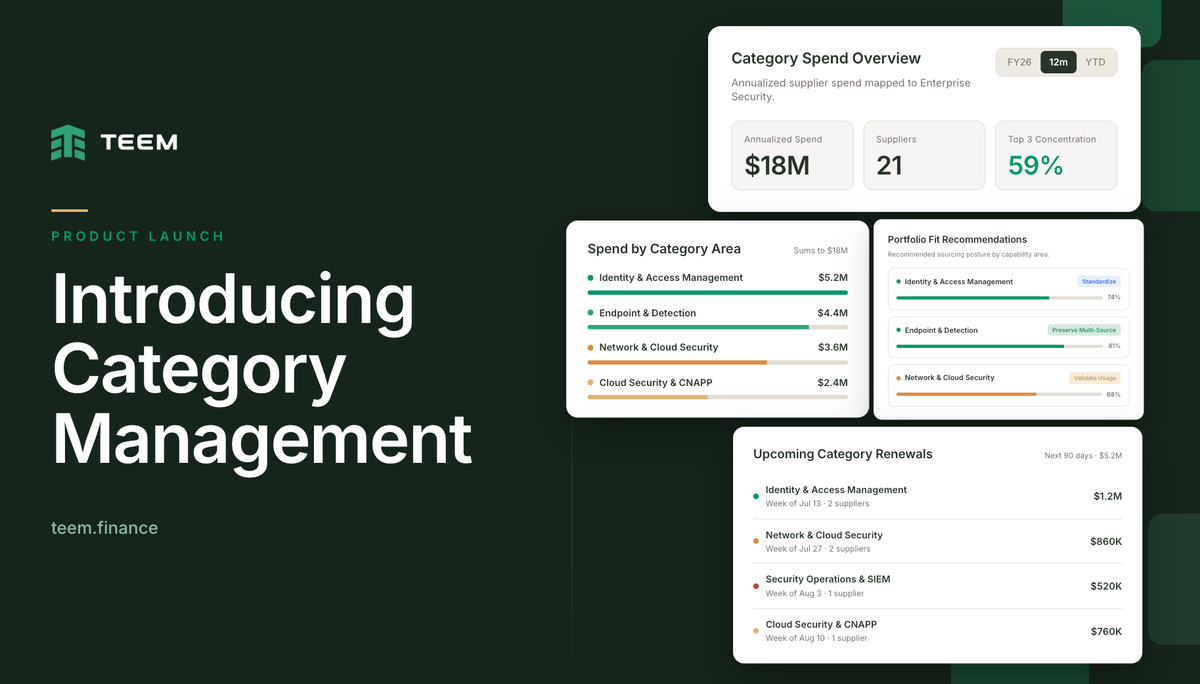
Today, we're launching Category Management in early access. Our customers — procurement leaders who've been using it firsthand — provided excellent feedback and suggestions for improvement. We built those in. What we're opening up now is the result.
The goal for Category Management is to answer these three questions:
- What is our current state in this category?
- What should the future supplier strategy be?
- How do we execute?
It gives category managers one evidence-backed view of a spend category, including the current state, supplier strategy, and execution, rather than a strategy stuck in someone's head or in a spreadsheet.
Most procurement teams already group spend by categories such as IT, marketing, or logistics. The hard part is keeping a coherent strategy for each one.
Category data is scattered across contracts, spend systems, supplier evaluations, market research, and stakeholder feedback. That makes it difficult to answer a basic question quickly: what's actually happening in this category, and what should we do about it?
Category Strategy: Built Around One Goal
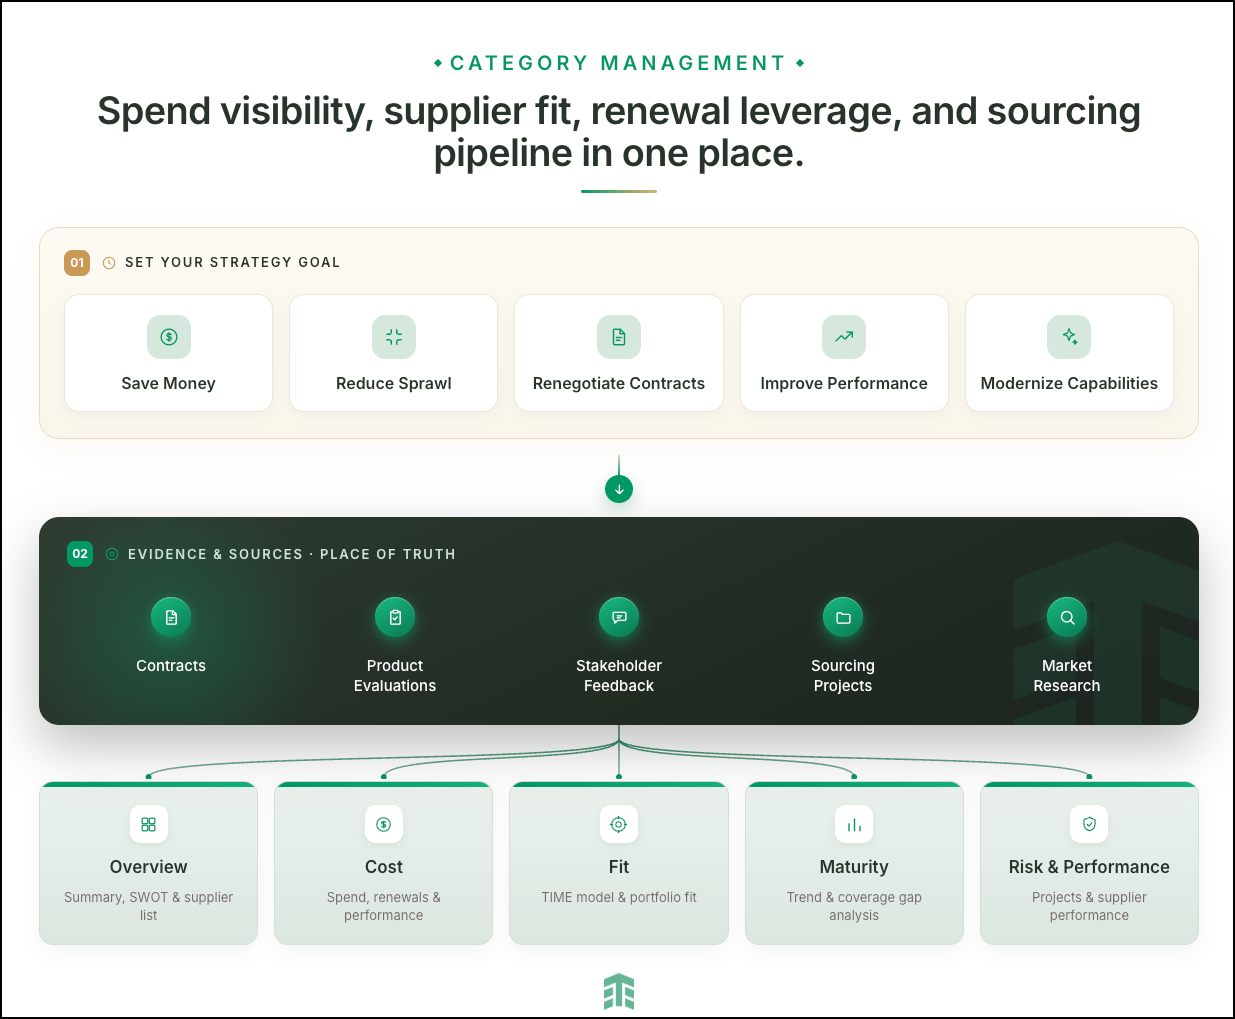
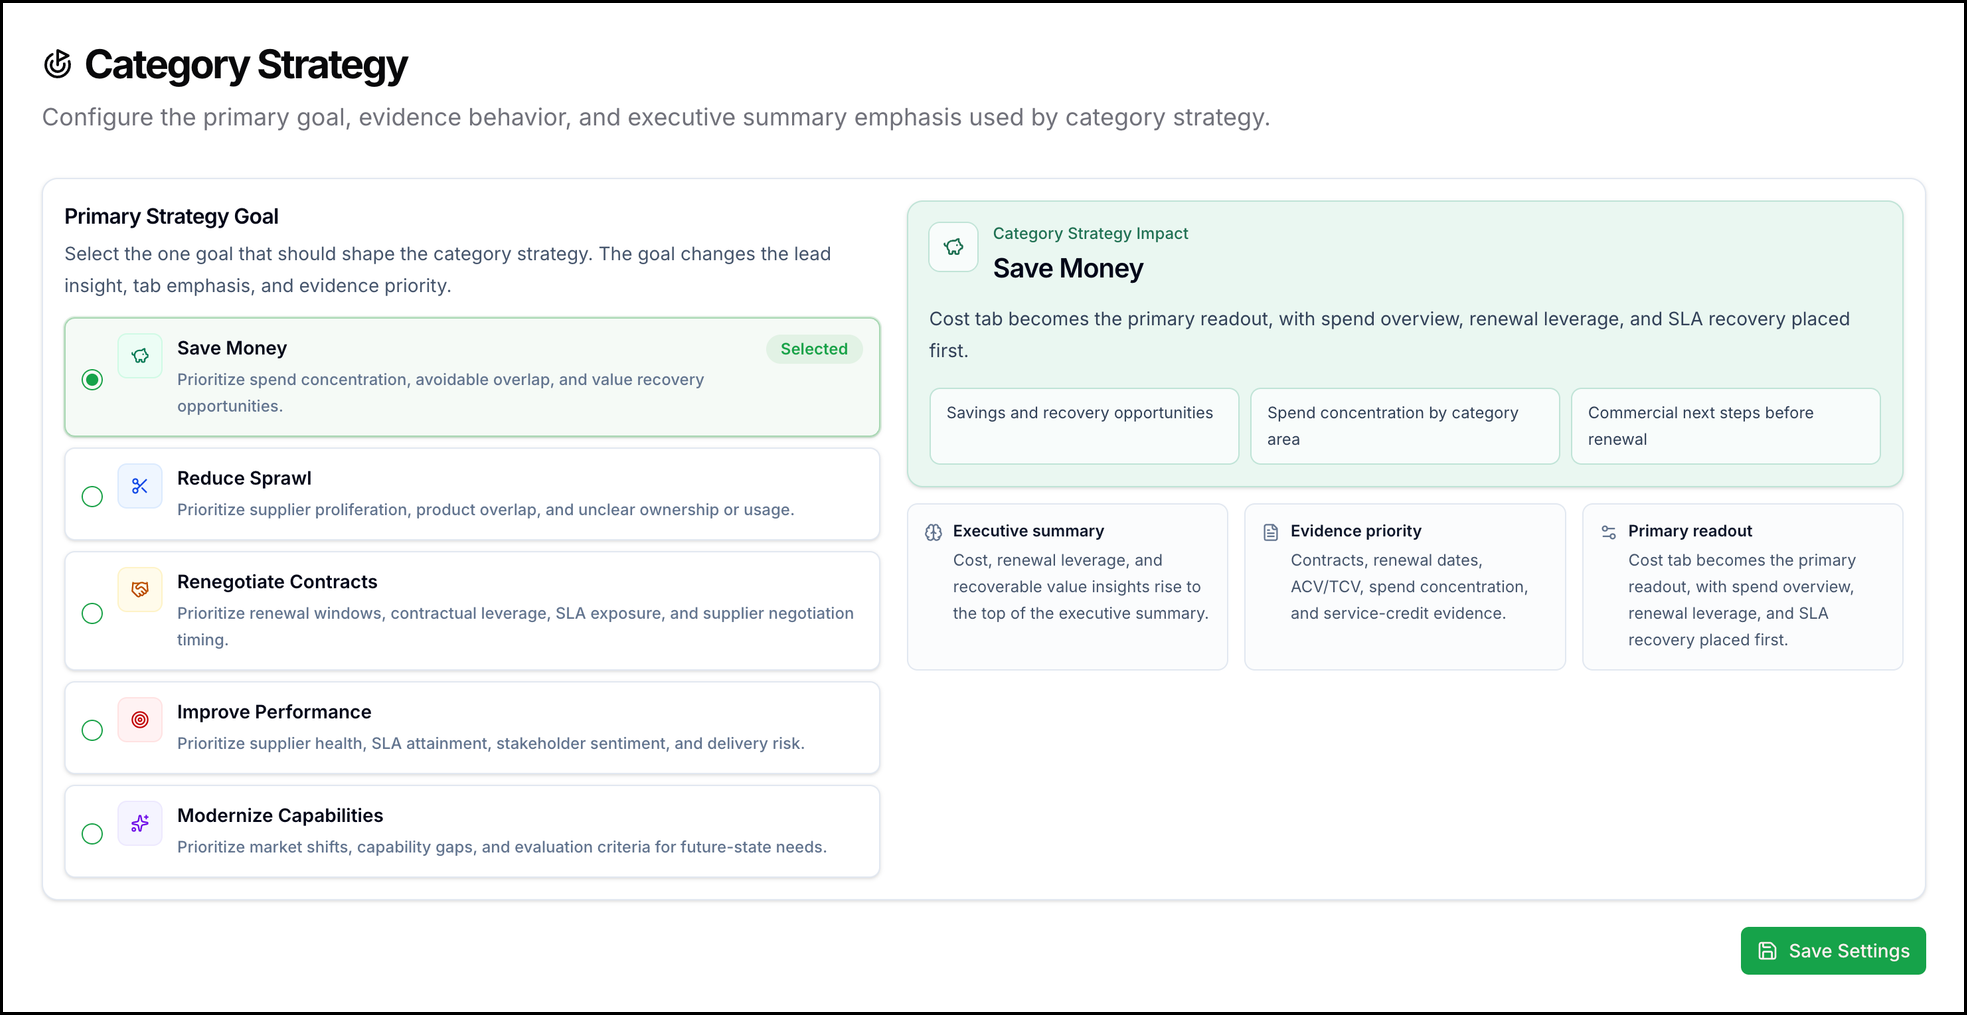
Before anything else, Category Management asks one question: what are you trying to accomplish in this category? Select a primary goal — Save Money, Reduce Sprawl, Renegotiate Contracts, Improve Performance, or Modernize Capabilities — and the platform orients everything around it. The executive summary shifts. The primary tab changes. Evidence gets re-prioritized. Every insight you see downstream is shaped by the goal you set here, not by a one-size-fits-all default.
Supplier Categories: Built on Teem's Intelligent Taxonomy
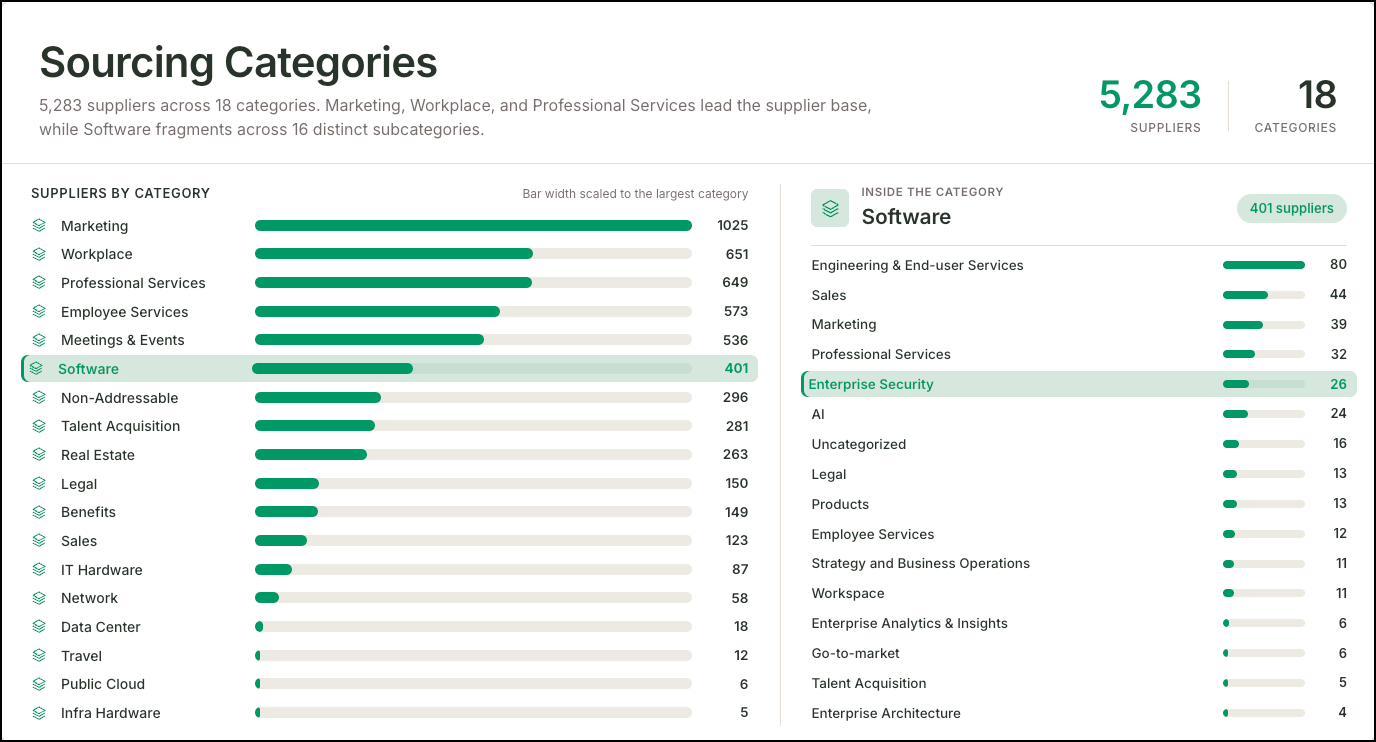
Category Management doesn't ask you to start from a blank slate. The category list itself can run on Teem's Intelligent Taxonomy out of the box, or you can bring your own existing structure, whatever your team already uses to organize spend. No re-classification project required just to get the product running, and no forcing your categories to match someone else's idea of how procurement should be organized.
Evidence & Sources: Place of Truth
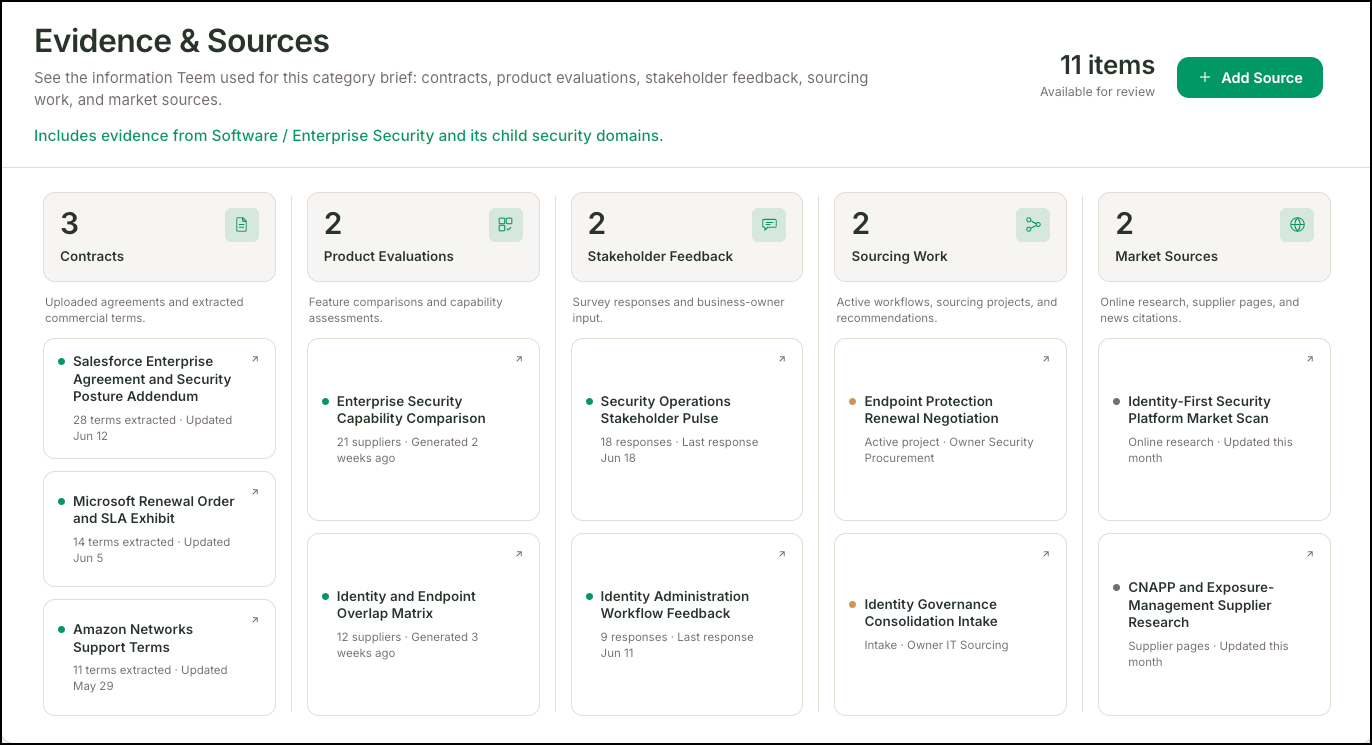
Automatic Ingestion
Contracts, product evaluations, stakeholder feedback, sourcing projects, and relevant market research are automatically pulled into the category as they occur. Today, that information is scattered across systems, and someone has to remember to look for it before it's too late. Here, it shows up on its own, and the panel builds itself as new information enters the business.
Add Your Own Sources
Not everything fits a category through an automated feed. Sometimes it's a market report, a vendor email, or a conversation worth capturing manually. Adding your own sources on top of the automated feed ensures nothing relevant gets left out, even if it didn't come through a system.
Full Traceability
When the platform recommends investing in a supplier or flags a renewal risk, the recommendation isn't a black box. AI-driven recommendations carry real budget weight, and procurement teams need to trust their origins. Every insight links back to the exact evidence behind it, so you can check the reasoning instead of taking it on faith.
Overview: The Executive Lens
Key Insights
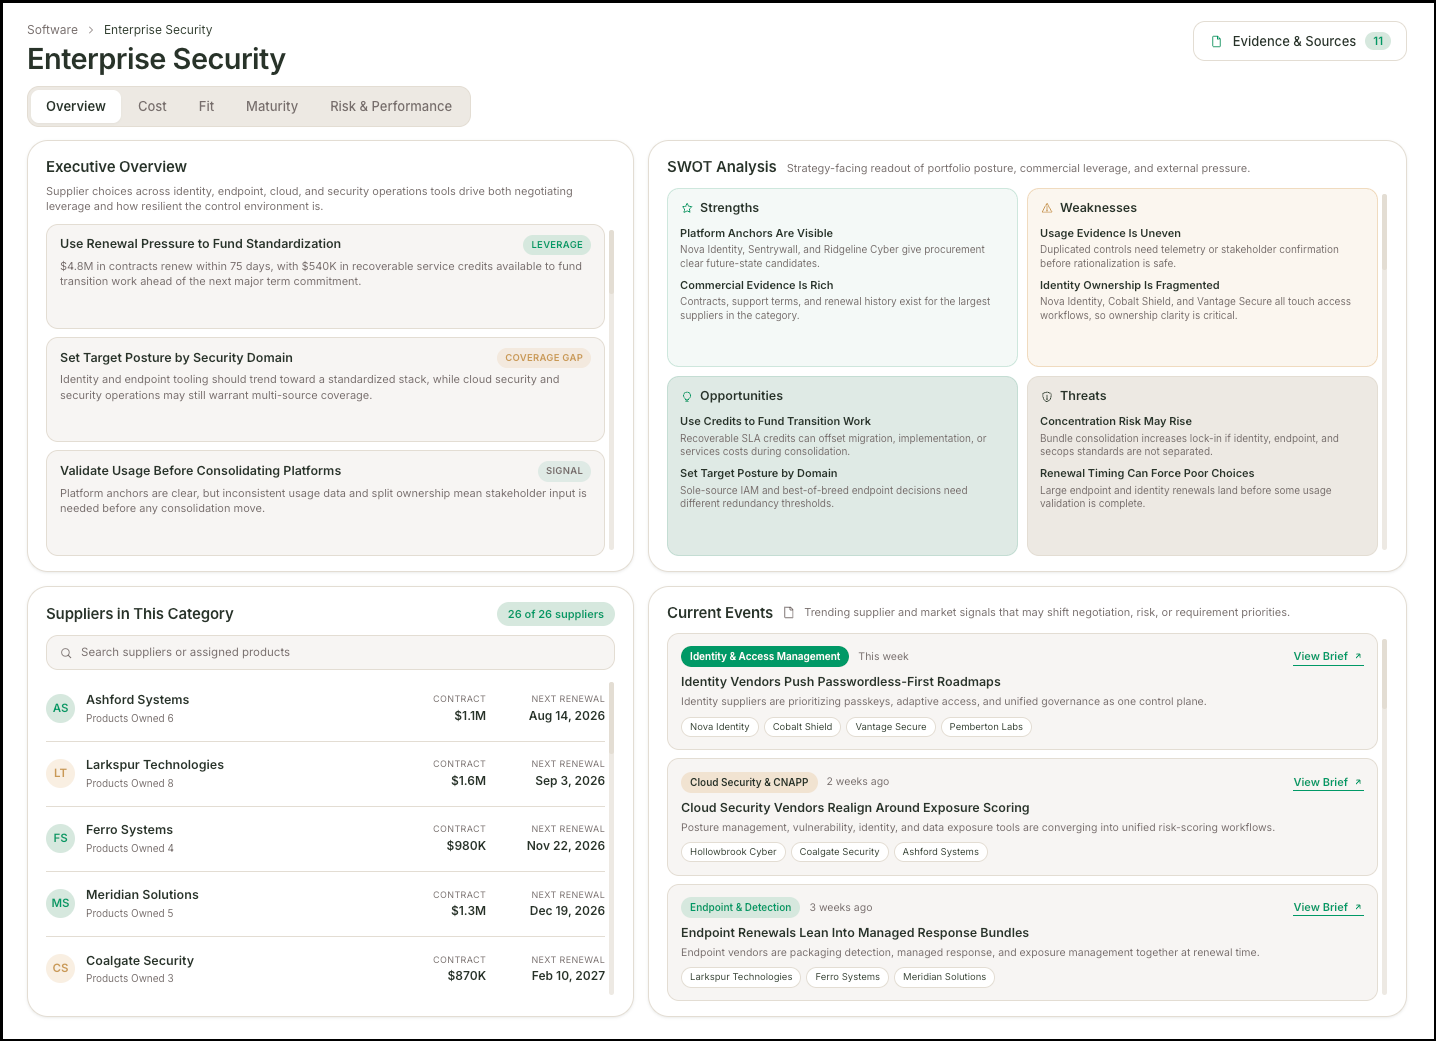
The Overview tab opens with an auto-generated executive summary that includes insights such as where renewal pressure could fund standardization or where usage needs validation before consolidating platforms. Reading through raw category data to figure out what actually matters takes hours. This puts the headline first, so you only dig into the details that are worth your time.
Supplier List
A full list of suppliers in the category sits below the summary, including contract value, next renewal, and a one-click link to a full profile. Knowing exactly who's in a category usually means hunting across several disconnected systems. Here it's one list, with depth a click away.
SWOT Analysis
A SWOT analysis is generated automatically for the category. Building one from scratch is a planning exercise that eats a full sprint on its own. Starting with a draft already in place means category managers spend their time refining it rather than building it from scratch.
Market Events Feed
Relevant market news and events, such as a memory chip shortage, a supplier acquisition, or a supply chain disruption due to global war, appear directly in the category, with briefs available for more details. These shifts normally show up only after they've already affected a negotiation. Seeing them here means they're visible before they become a surprise.
Cost: Where the Money Actually Goes
Category Spend Overview
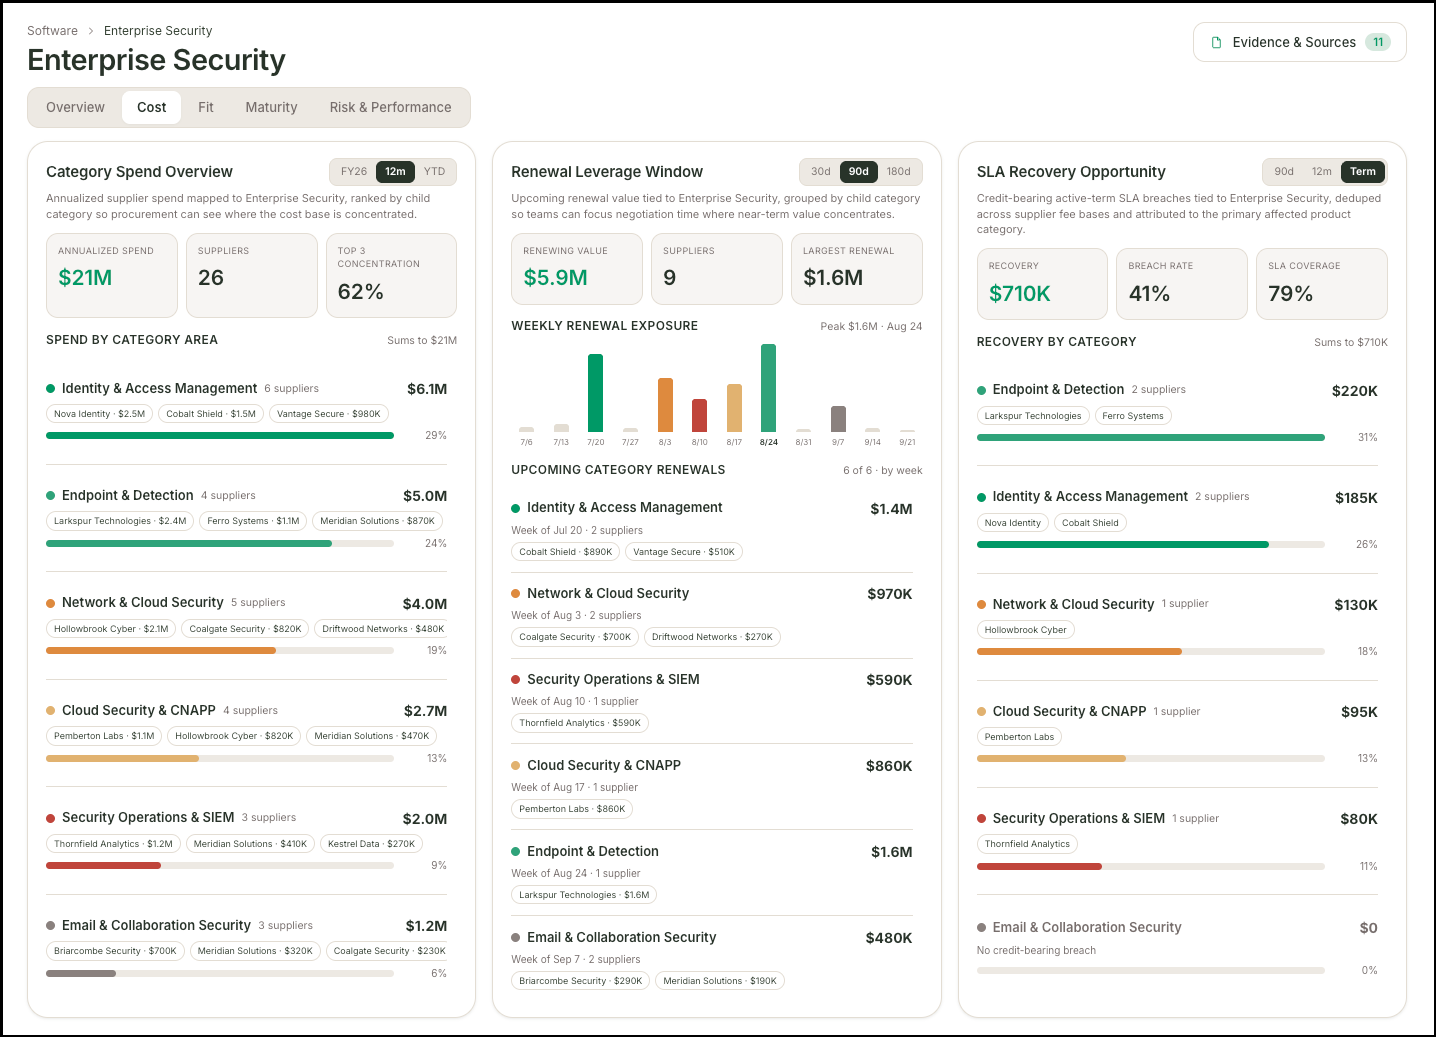
Annualized spend gets broken down by subcategory and ranked, showing exactly where cost and supplier density concentrate. Spend data is normally scattered across ERPs and expense systems with no single place to see the full picture. This makes it obvious at a glance which vendors hold most of a category's budget, and nobody has examined them closely.
Renewal Calendar
Upcoming contract renewals surface as cards within the category. Renewal dates tracked in spreadsheets tend to go unnoticed until they're already urgent. Seeing them here ahead of time turns a last-minute scramble into a planned conversation.
Supplier Performance Snapshot
A quick read on supplier health sits at the bottom of the tab. Cost alone doesn't tell you whether a supplier relationship is actually working. This gives a first signal before you go deeper into the full performance view under Risk.
Fit: What to Do With Each Supplier
TIME Model Placement
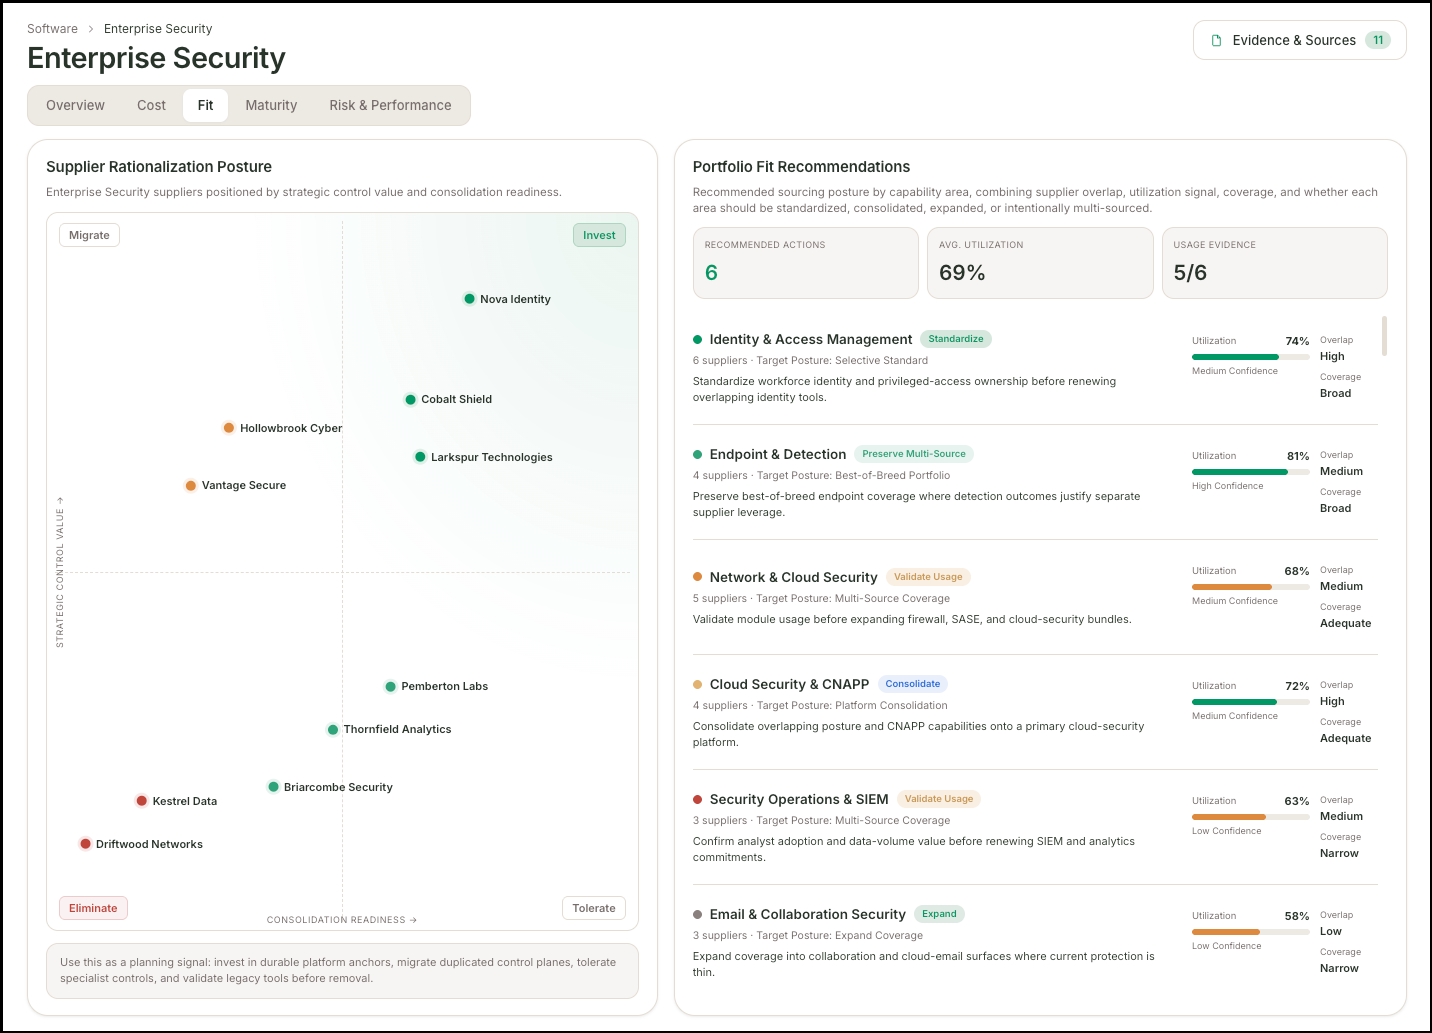
Every supplier is automatically positioned using the Gartner TIME model —Tolerate, Invest, Migrate, Eliminate—based on the evidence supporting it. Deciding where a supplier belongs is usually a gut call made by whoever's held the category longest. Generating the placement from actual evidence means the decision survives that person leaving the role.
Portfolio Fit Recommendations
Recommendations on sourcing posture by capability area weigh supplier overlap, utilization, and coverage. Suppliers covering the same capability often go unnoticed until a budget review forces the question. Surfacing the overlap directly points to where consolidation is worth considering, not just where spend happens to be high.
Maturity: Reading the Market
Trend Mapping
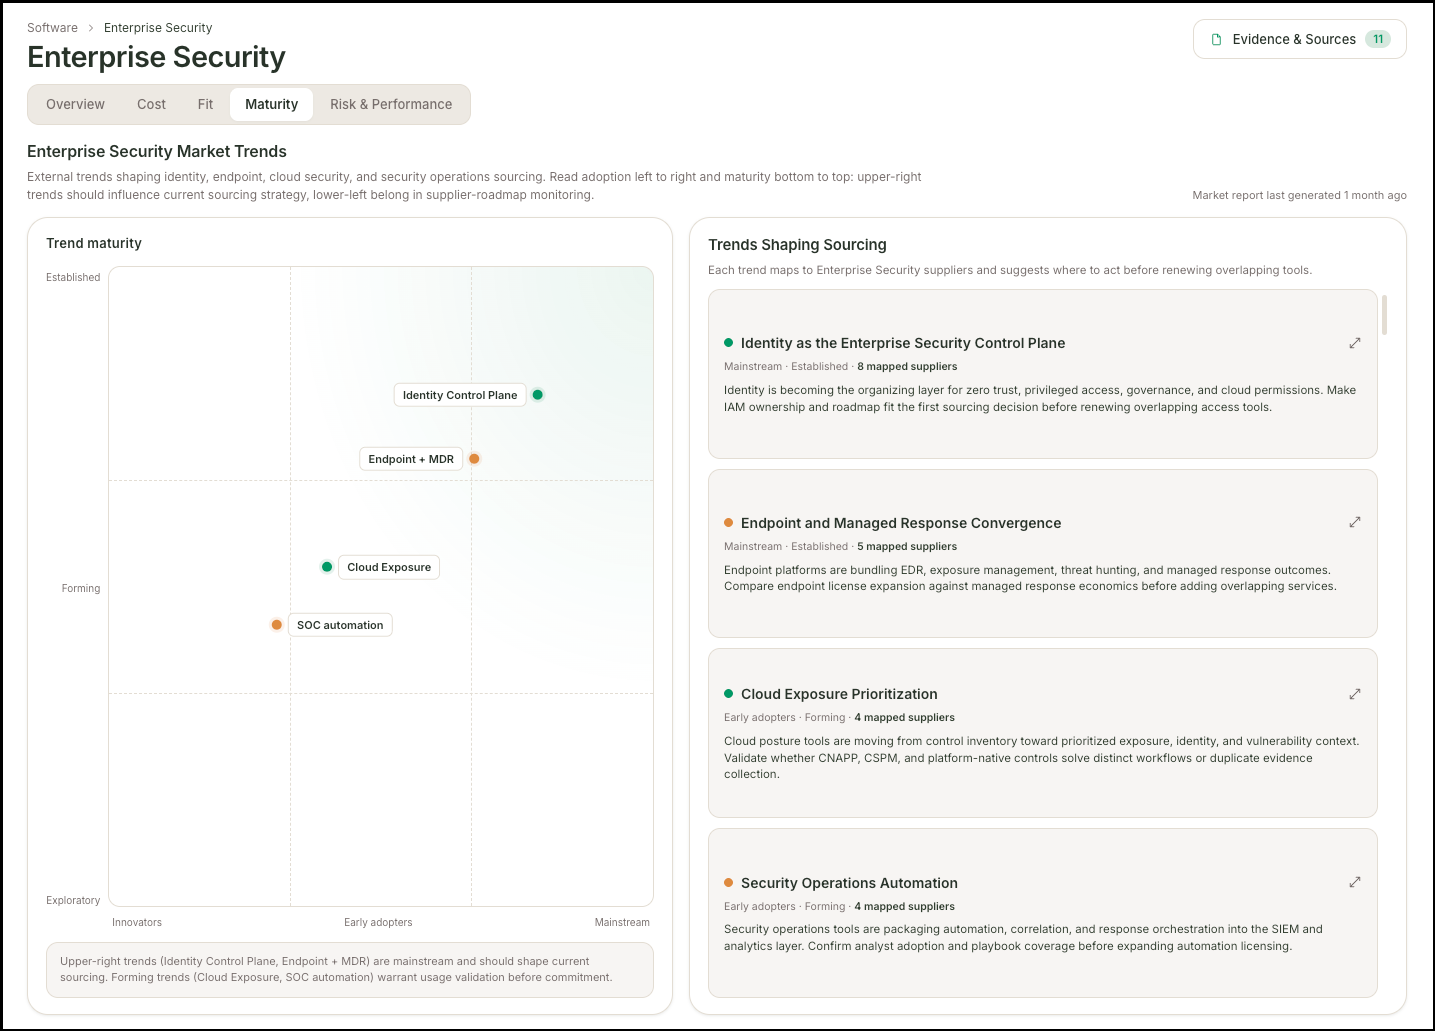
Relevant use cases are mapped across two axes: how established or emerging a trend is, and whether adoption skews toward the mainstream or toward more innovation. Coverage is color-coded directly on the chart. Staying current on where a category's market is heading is normally a research project nobody has time to run regularly. This keeps that picture up to date without anyone having to chase it down.
Use Case Drill-Down
Clicking into any use case highlights which suppliers are already mapped to it, along with others worth evaluating. Spotting a coverage gap is one thing, but knowing who could fill it is another. This connects the two in a single click, rather than starting a fresh evaluation from scratch.
Risk & Performance: Beyond SLA
Sourcing Project Visibility
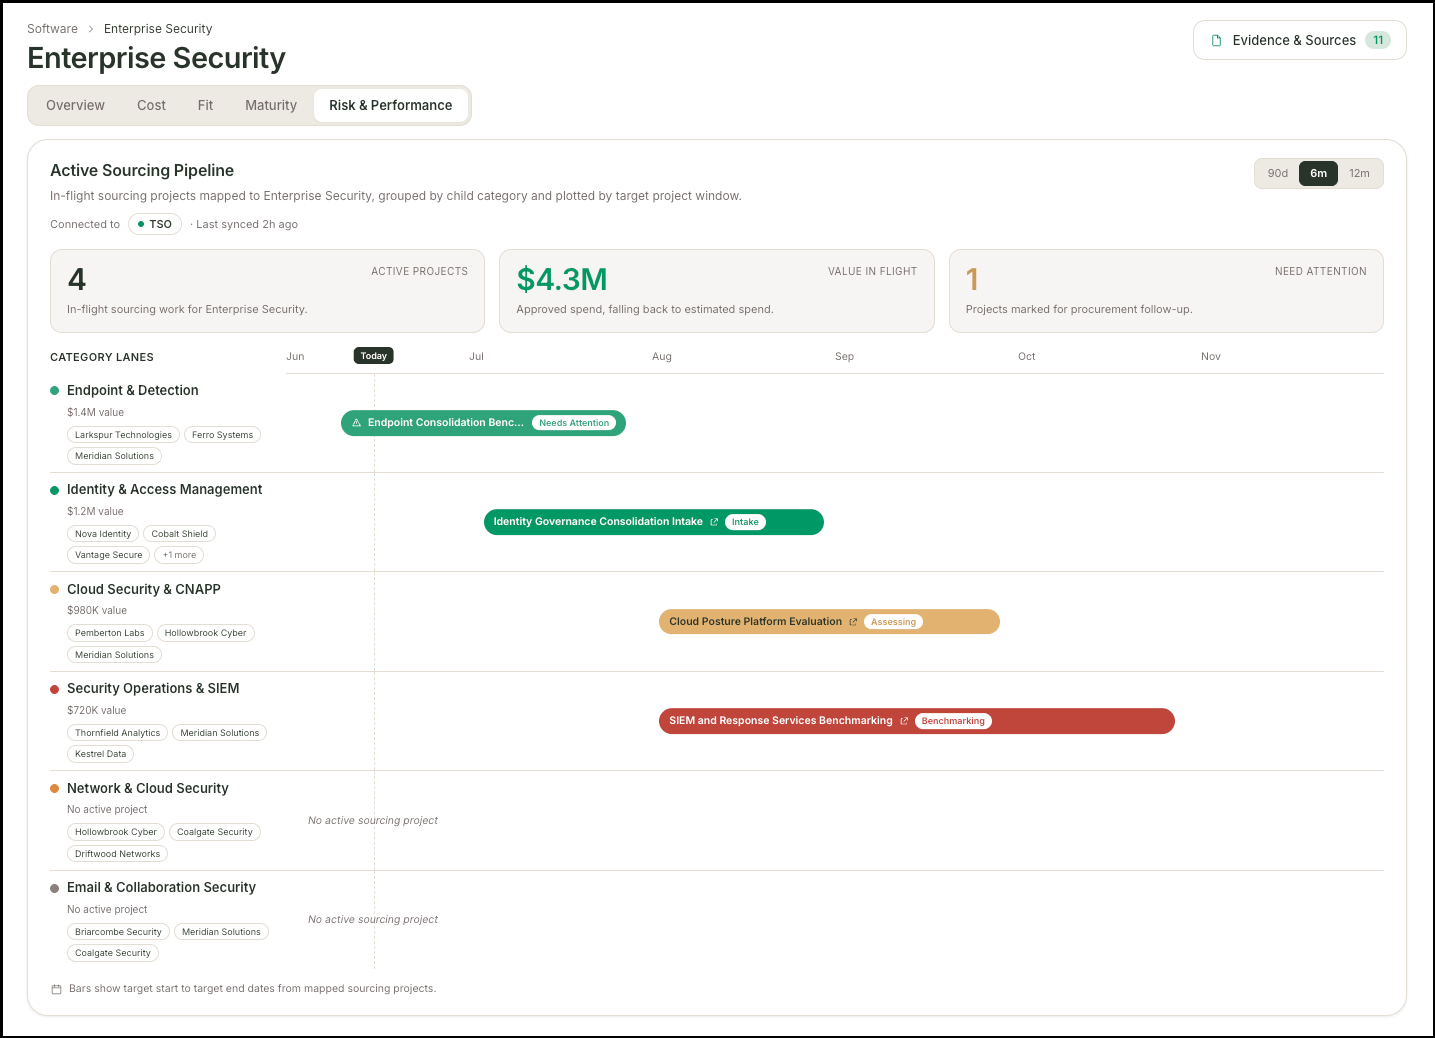
Active sourcing projects surface directly inside the category view. When sourcing work lives in a separate system, it disconnects from the strategy that's supposed to be driving it. Seeing what's already in motion here means you can jump straight to it instead of asking around to find out.
Multi-Criteria Supplier Performance
Supplier performance tracking is expanding beyond SLA alone to include responsiveness and roadmap delivery, visualized on a single spider chart. SLA-only tracking misses most of what actually makes a supplier good to work with. One chart now shows strength and weakness across every dimension that matters, not just whether a contract term was met.
See It In Action
Category planning shouldn't run on a quarterly spreadsheet exercise and shouldn't rely on whoever remembers to update it. Book a demo, and we'll walk you through how Category Management works on your actual category data.
Learn more at teem.finance or see it live over here.