Introducing Consolidation Planner: What to Keep, What to Eliminate, and the Evidence Behind It
Portfolio Analysis shows where your products overlap and tells you what to consolidate. The Consolidation Planner shows what to keep, what to eliminate, and exactly what you'd give up before you decide.
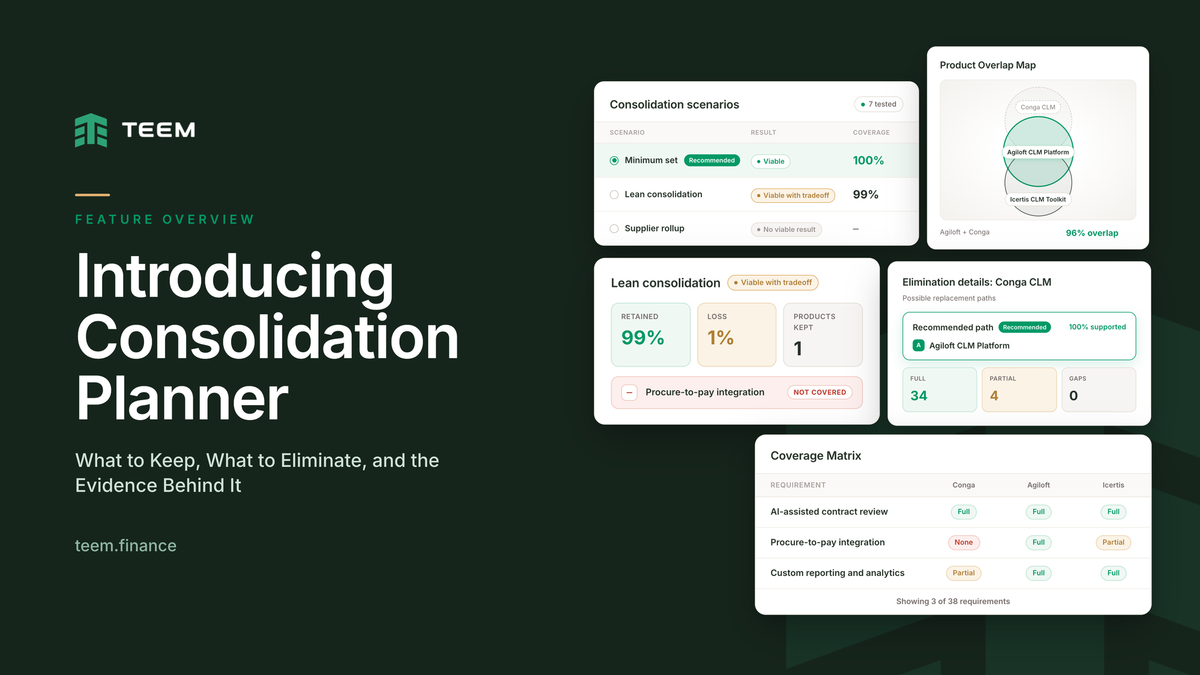
Portfolio Analysis shows where your products overlap and tells you what to consolidate. The Consolidation Planner shows what to keep, what to eliminate, and exactly what you'd give up before you decide.
Portfolio Analysis answers one question well: what can we consolidate? It finds products doing the same job, scores each opportunity, and adds the renewal date.
Then a harder question shows up.
You know three contract management tools overlap. Which ones do you keep? What do you lose if you cut one? And how do you settle it when every team is sure theirs does something the others can't?
In most procurement teams, that part happens in a spreadsheet, weeks after the opportunity was found. Sometimes it happens after one of the contracts has already renewed.
The Consolidation Planner closes that gap. It sits inside every Portfolio Analysis opportunity and turns it into a plan: what to keep, what to eliminate, and the evidence behind that recommendation.
It answers three questions:
- Which products do we keep to retain the capability we need?
- If we eliminate a product, what covers its work?
- What exactly do we lose, if anything, under each scenario?
1. Consolidation scenarios
Once overlap is found, the debate starts. One team wants to keep their tool. Another says theirs does more. Nobody can say what the business actually loses if a product goes.
Why it's needed: Cutting to one product saves the most but may drop something people rely on. Keeping everything saves nothing. Procurement needs to see the trade-offs side by side before anyone commits.
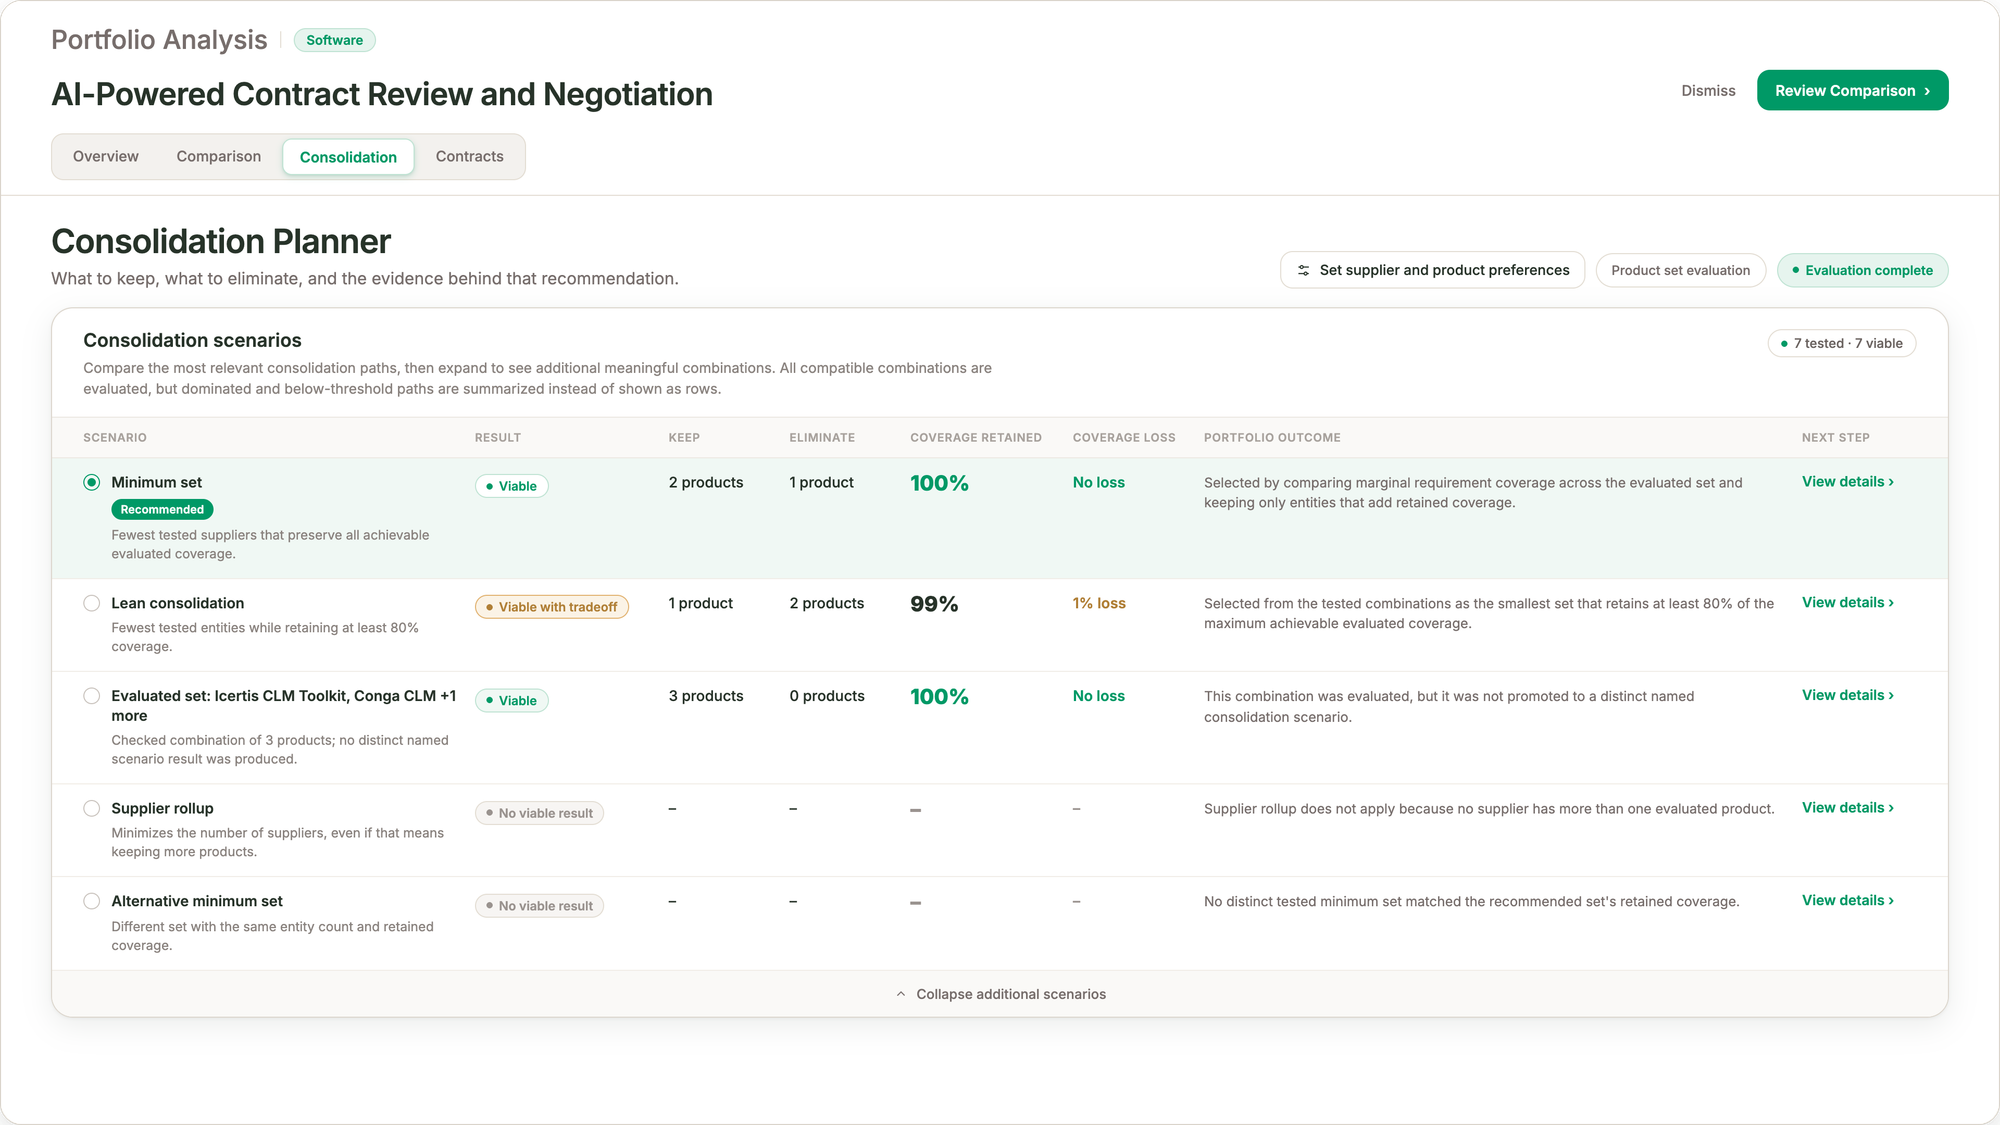
How we solve it: The planner tests every compatible combination of your products and surfaces the strongest as named scenarios. Each one shows which products you keep, which you eliminate, and how much functional coverage you retain.
In a contract management opportunity with Icertis, Conga, and Agiloft, the planner returns two named scenarios:
- Minimum set (recommended). Keep Icertis and Agiloft, eliminate Conga, and retain 100% of evaluated coverage.
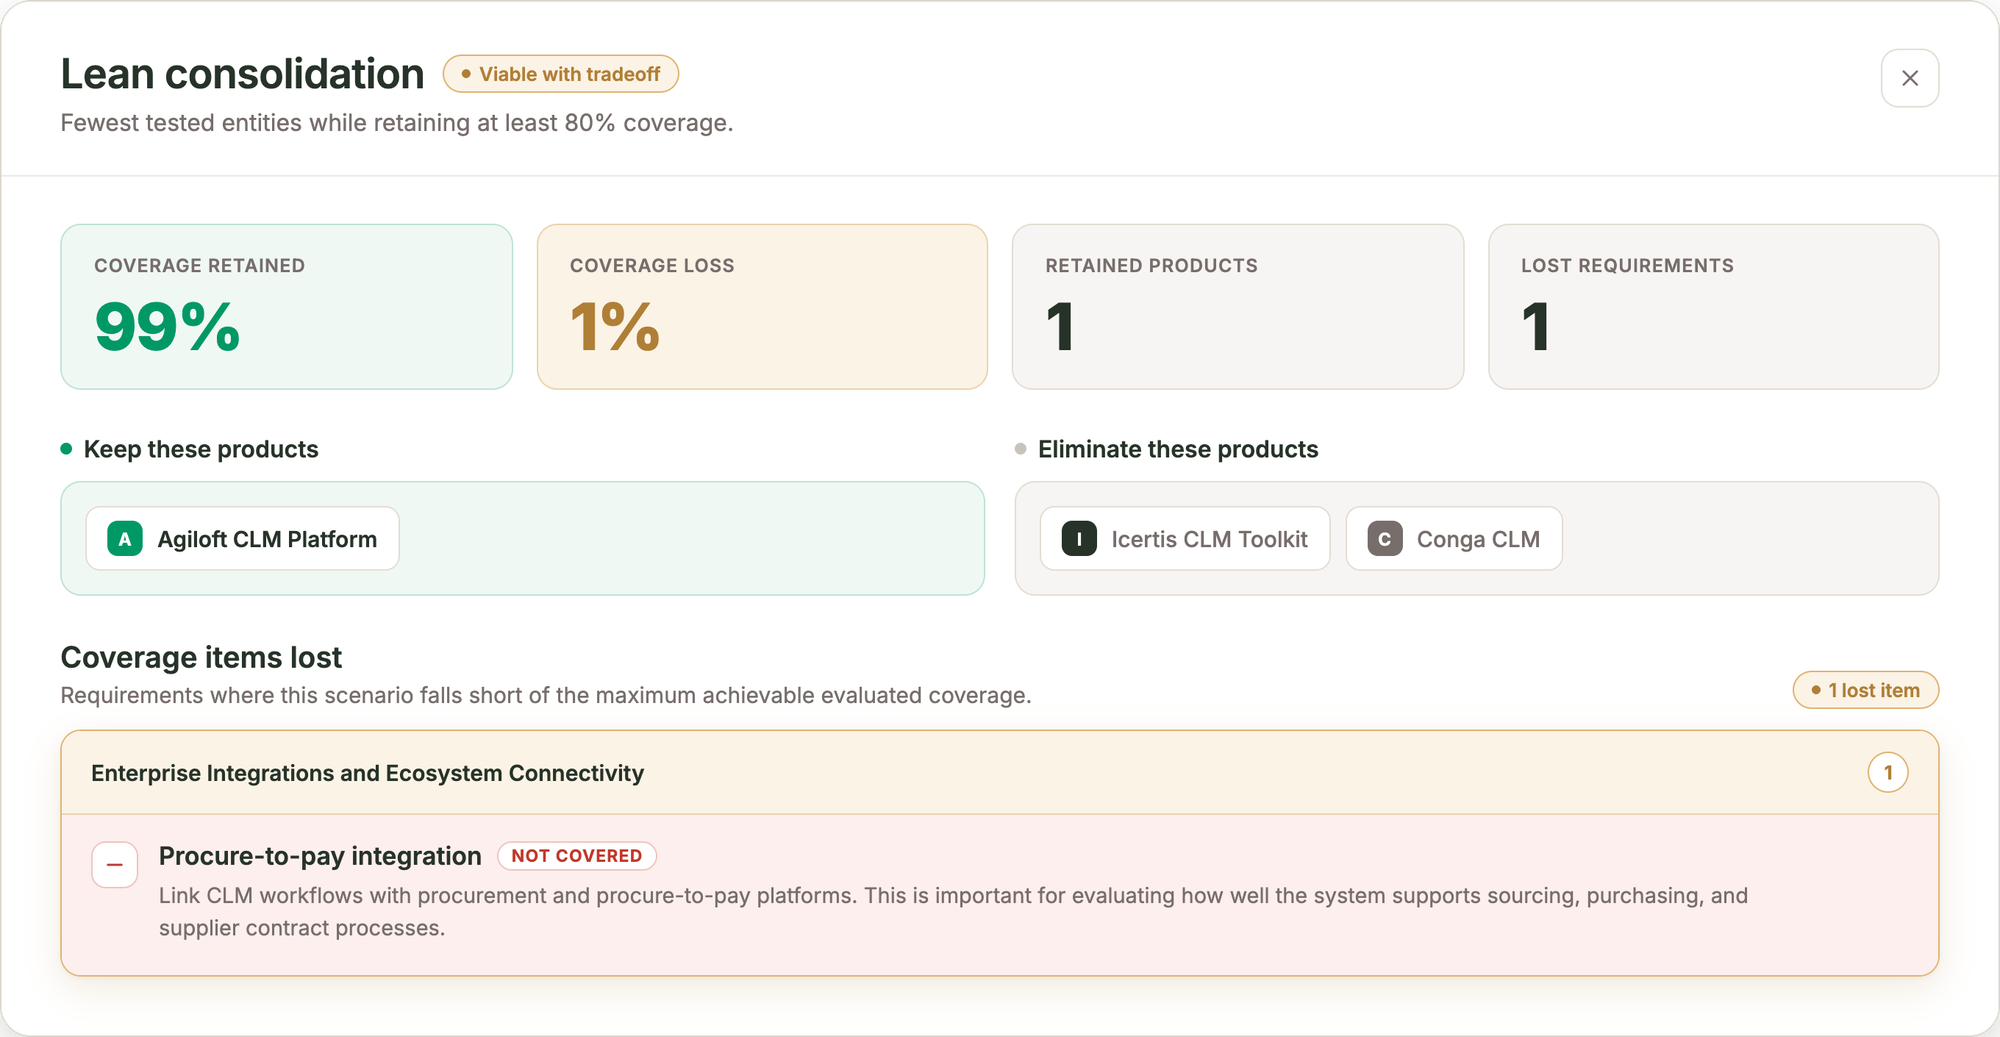
- Lean consolidation. Keep only Agiloft and retain 99%.
That 1% matters, so the planner names it. Open the scenario, and it lists the one requirement you'd lose: procure-to-pay integration. Now the decision is concrete. Is that integration worth keeping a second contract?
Scenarios that don't fit your portfolio say so. If no supplier has more than one product, Supplier Rollup reports that it doesn't apply instead of forcing a result. You can also set supplier and product preferences before the planner runs.
Pick a scenario and every view below updates to match: the overlap map, the elimination map, and the coverage matrix all show the evidence for that choice.
2. Product Overlap Map
Overlap is easy to claim and hard to prove. "They basically do the same thing" rarely survives a stakeholder meeting.
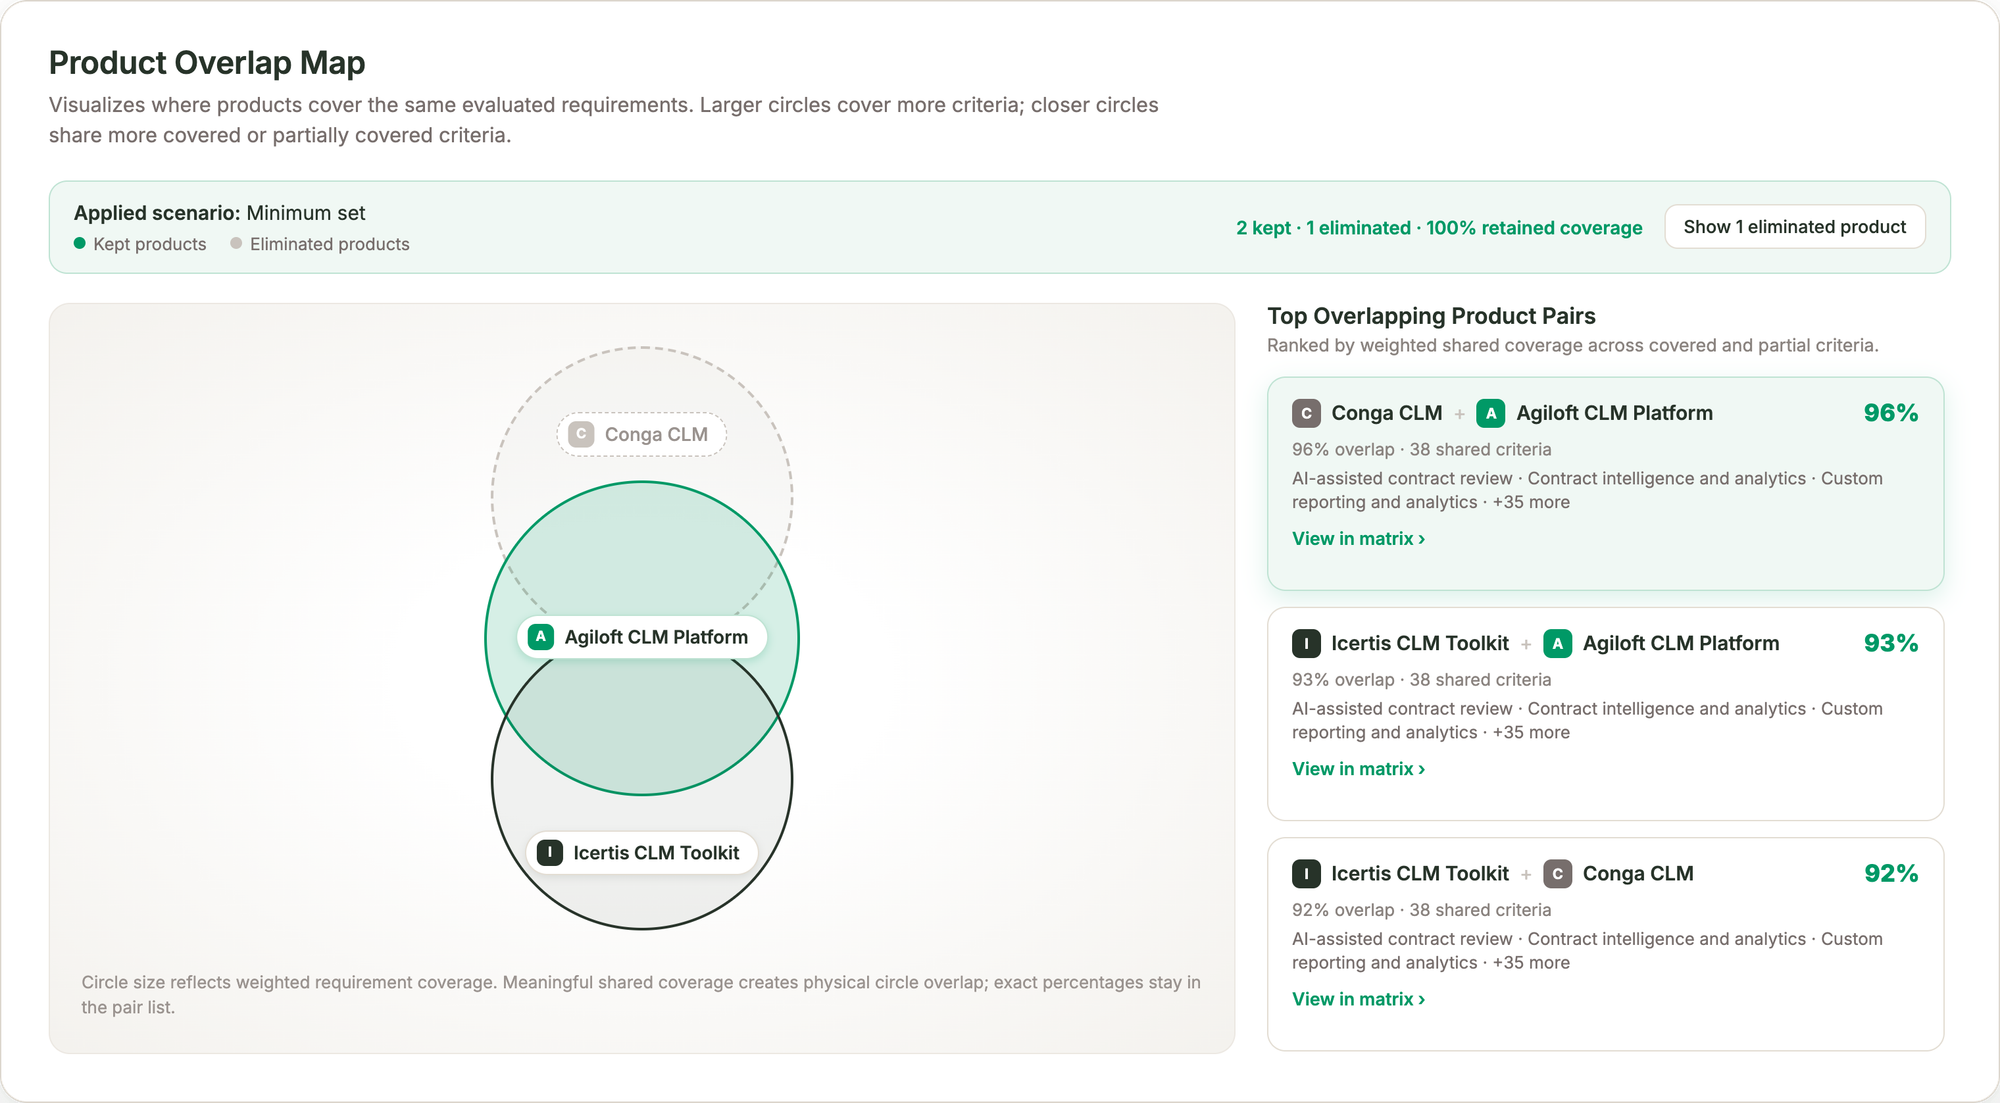
Why it's needed: Before eliminating anything, you need to show how much two products actually share, at the requirement level.
How we solve it: The map draws each product as a circle sized by the requirements it covers, with shared coverage shown as overlap. Beside it, the top overlapping pairs are ranked. In the CLM example, Conga and Agiloft overlap 96% across 38 shared criteria. Click any pair to see those requirements in the coverage matrix.
3. Elimination map
Deciding to cut a product is easy. Knowing what picks up its work is where plans stall.
Why it's needed: A product rarely maps one-to-one onto another. Some of its work moves cleanly, some only partly, and the partial pieces are where migrations go wrong.
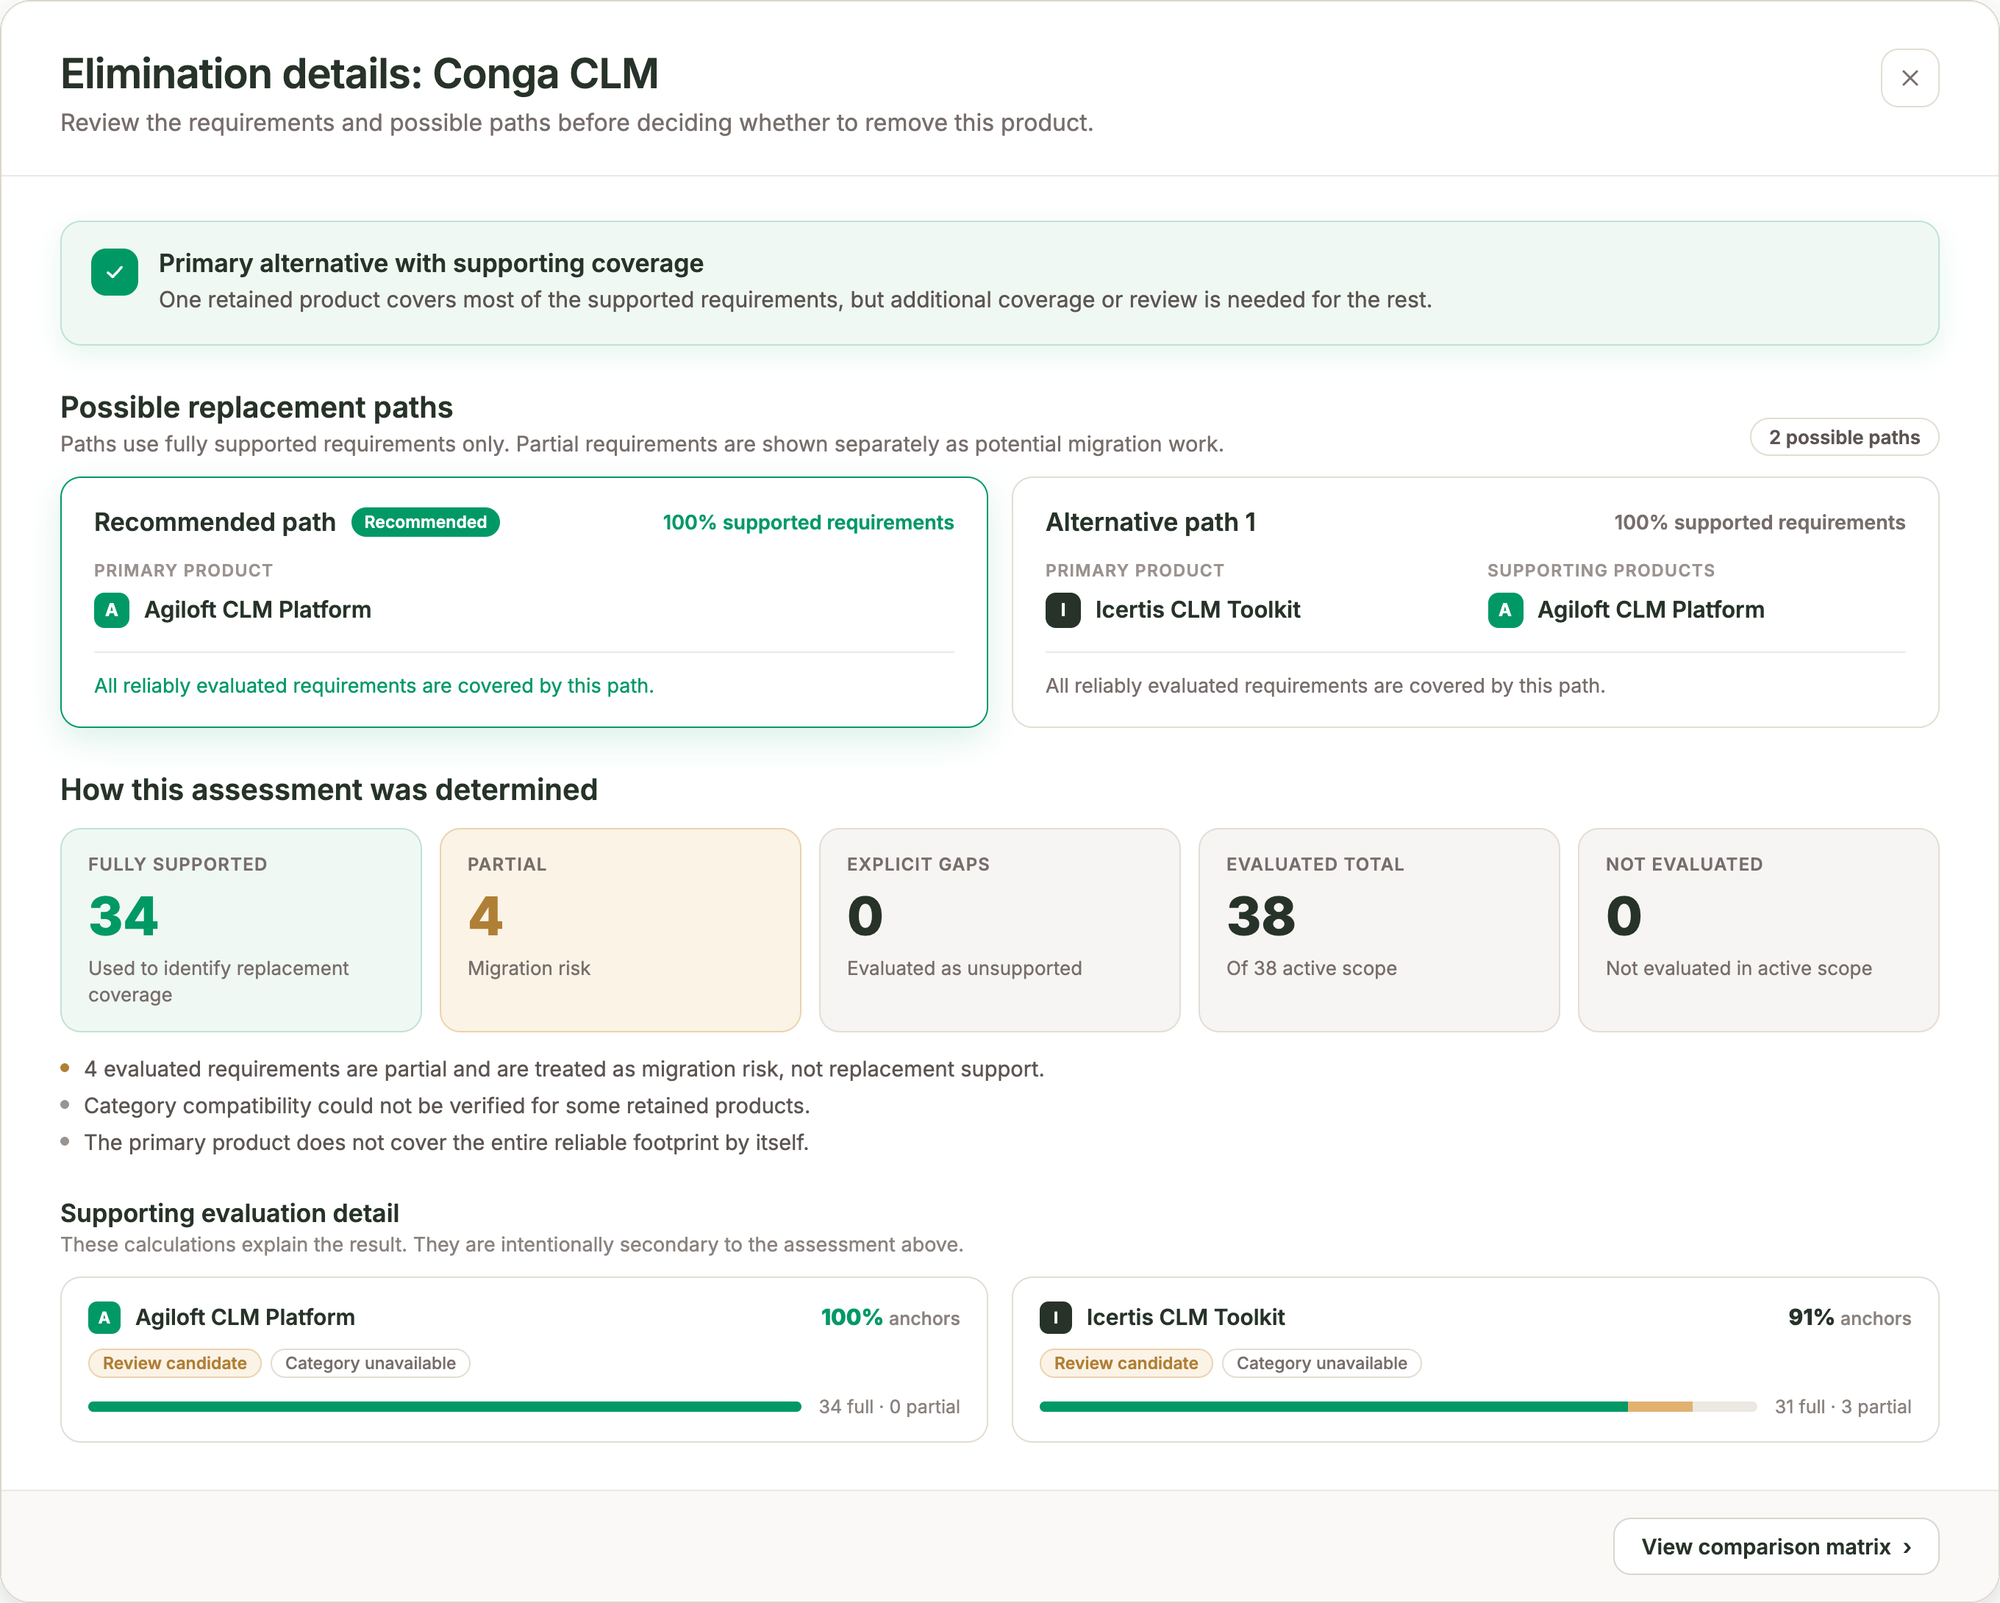
How we solve it: For every product being eliminated, the planner shows its replacement paths. Conga supports 38 evaluated requirements. The recommended path moves all of them to Agiloft. An alternative path uses Icertis as the primary product, with Agiloft covering the rest.
The detail view separates full coverage from partial. Of Conga's 38 requirements, 34 are fully supported elsewhere, and 4 are only partially supported. Partial matches count as migration risk, not coverage, so they show up as work to plan instead of a surprise after go-live.
4. Requirement Coverage Matrix
The hardest question in any consolidation is "what are we giving up?" It usually gets answered from memory, by whoever is loudest in the room.
Why it's needed: Business owners will push back on any consolidation that looks like it removes something they use. Requirement-level evidence settles that faster than opinion.
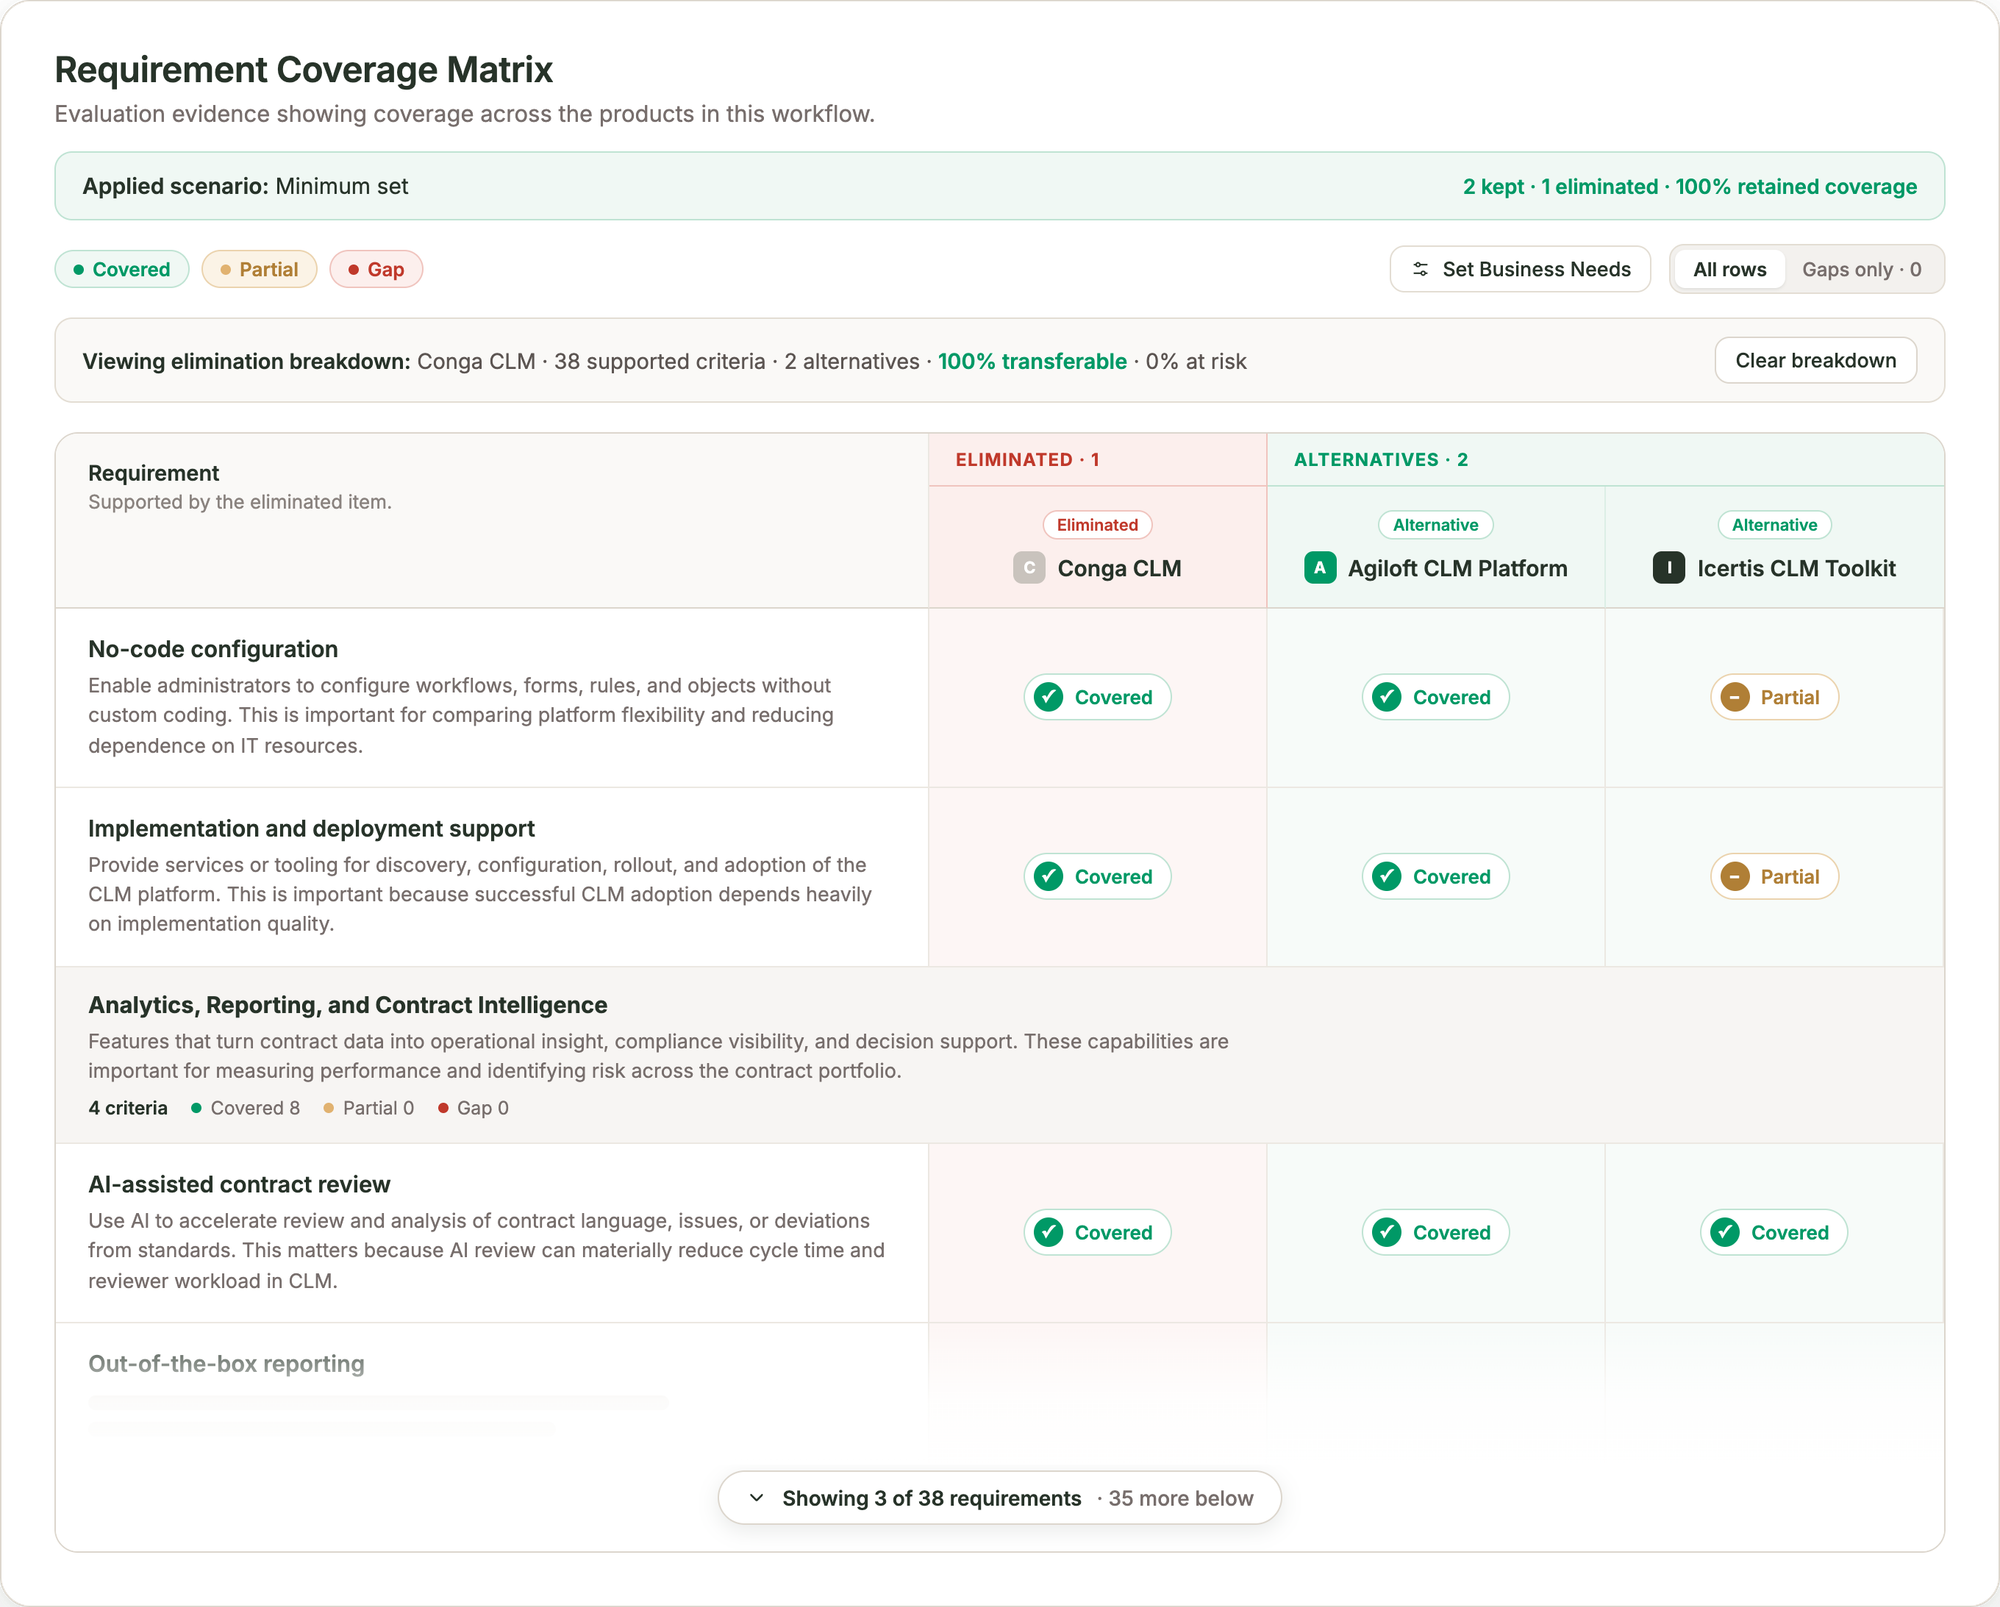
How we solve it: The matrix lists every evaluated requirement, grouped by capability area, and marks each product as Covered, Partial, or Gap. Kept and eliminated products sit in separate columns, so gaps show before the decision is final. Filter to gaps only, or set business needs to decide which requirements count.
A check on the comparison itself
Not every set of products should be compared head-to-head. When products span different capability areas, the planner flags it, rates comparability, and suggests a narrower comparison. A recommendation is only as good as the comparison behind it.
Where to find it
The Consolidation Planner lives in Portfolio Analysis. Open any opportunity and select the Consolidation tab. You can also reach it from Feature Comparison and Supplier Comparison while evaluating products side by side.
Once you've chosen a path, Stakeholder Surveys can confirm it with the teams affected, and a Business Case can take it to budget owners.
Try it
Already using Teem? Open any opportunity in Portfolio Analysis and click the Consolidation tab. Log in to Teem
New to Teem? Book a time on my calendar, and I'll walk you through a Consolidation Planner built on a real portfolio.

